Adjusting Tests via Usage Profiles
Of particular importance for the validation of a system are specific usage profiles that focus the test execution on selected usage states or sets of usage states.
A usage profile provides a way to deal with different user groups interacting with the system under test, e.g., system administrators and normal users. It is a description of all possible usage situations (states) and all expected usage scenarios (transitions) for a given user group, represented in a dedicated transition matrix for the usage model (see Example: Markov chain usage model).
In the following, we present a test suite built by using the OneWayVisa usage profile. The main reason is to focus the test of the AgileTravel web application on those parts relevant for booking one-way flights with a Visa credit card.
Generation of the Test Suite
Step 4: select a usage profile
In this additional step we select the OneWayVisa usage profile.
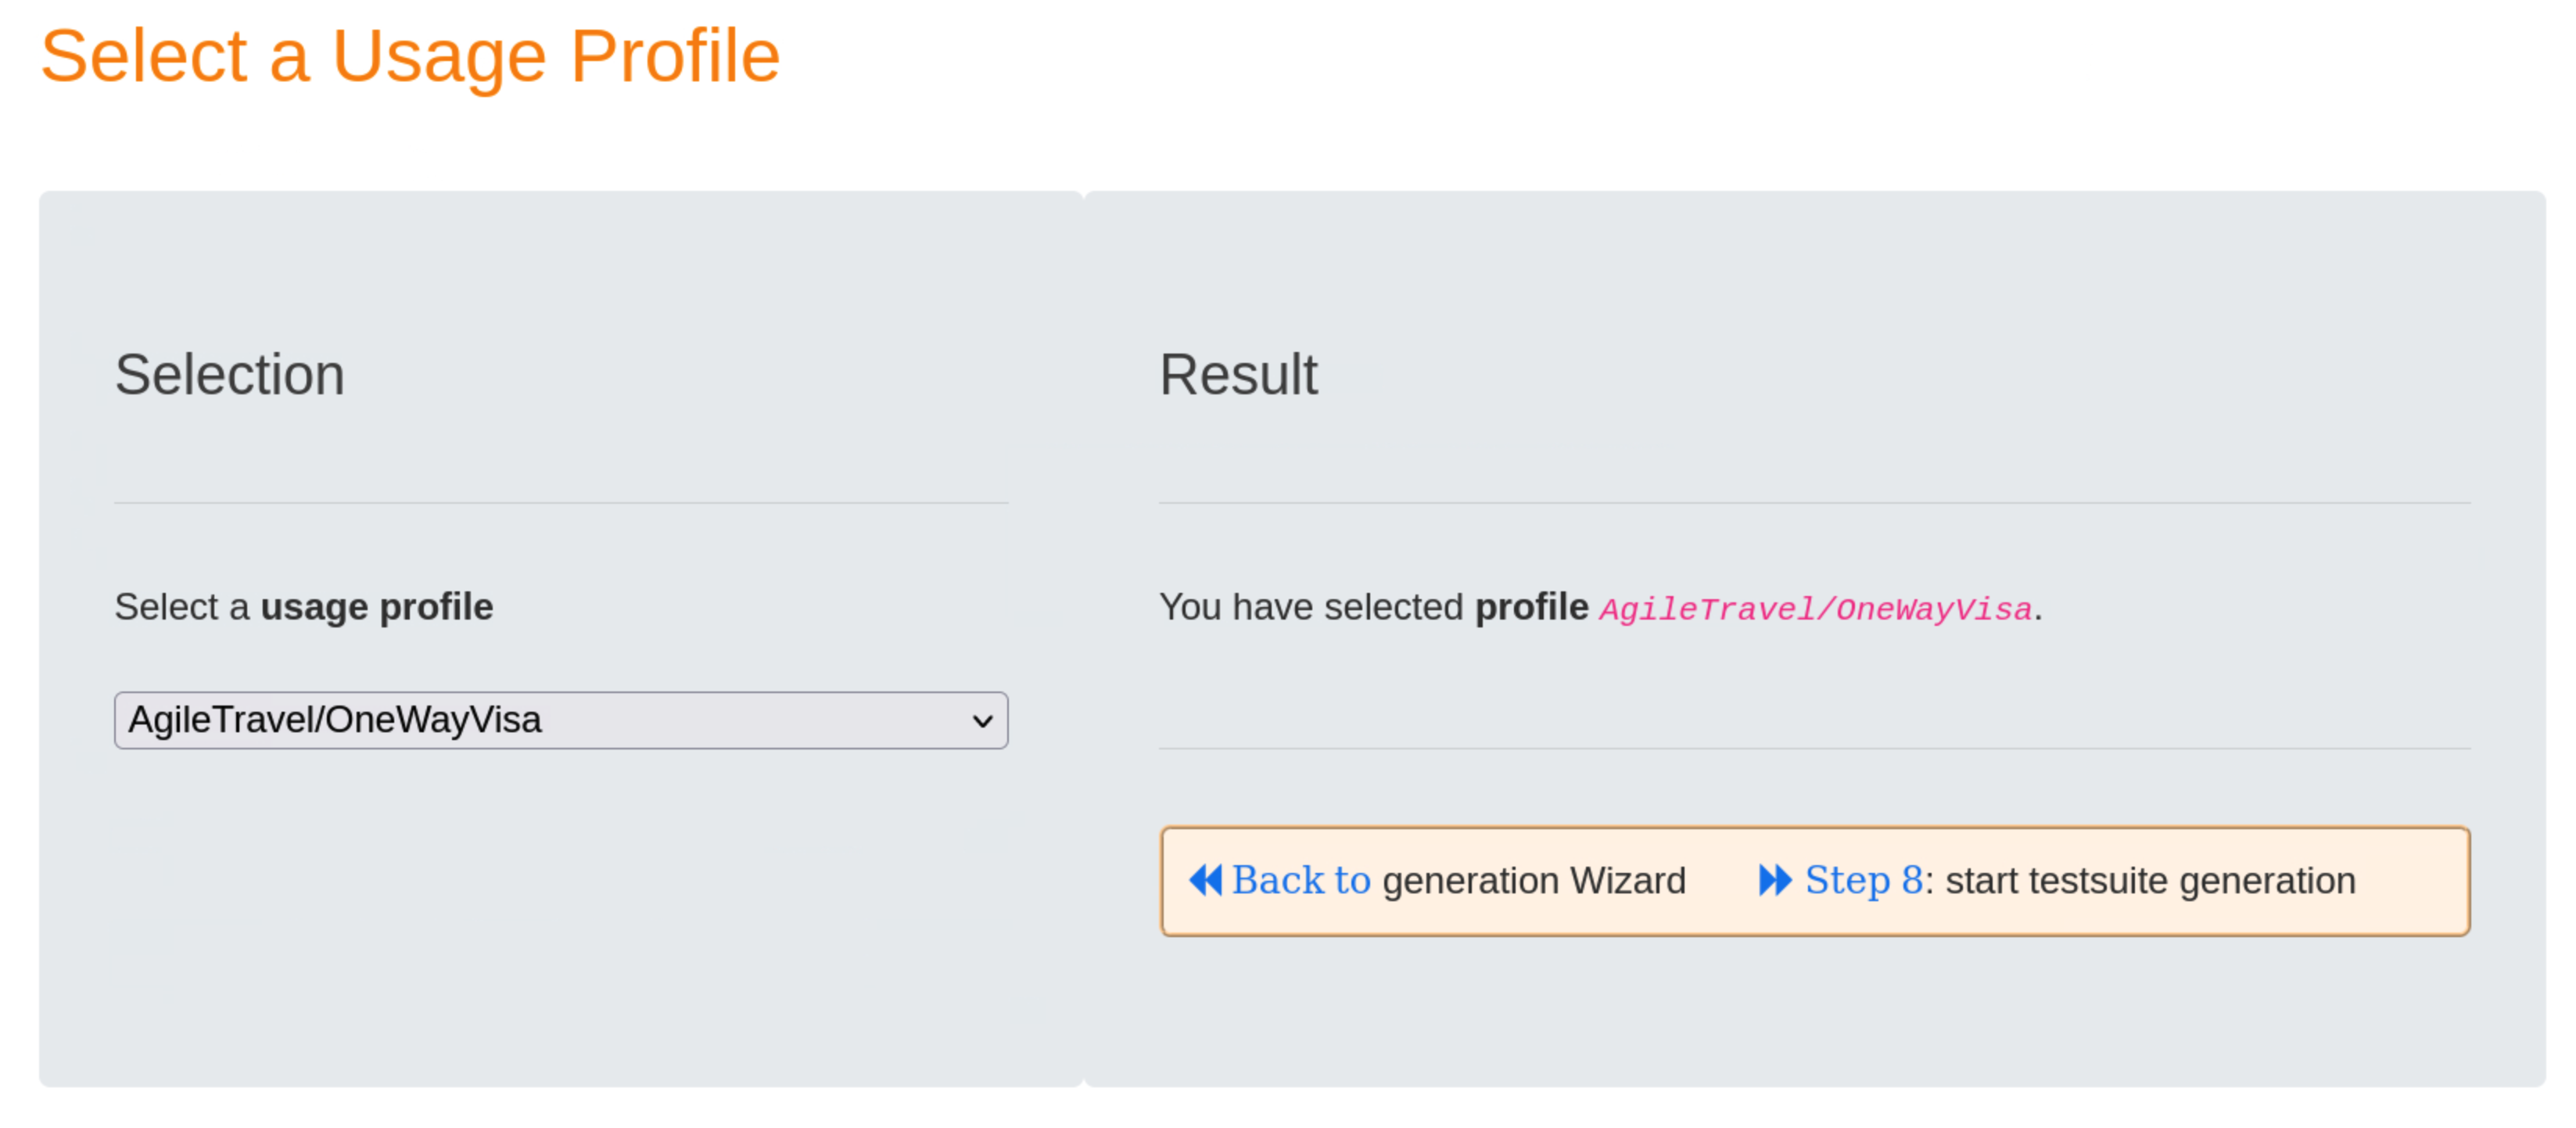
Clicking on the blue « Back to link will take you back to the Test Suite Generation Wizard.
OneWayVisa define adjusted probability values for the edges in the usage profile and will focus the test of the AgileTravel web application on those parts relevant for booking one-way flights with a Visa credit card.
p9 1 indicates that the edge for transition event e9 will be visited with probability 1 during the test, while p27 0 implies that the edge for transition event e27 will not be visited during the test. The full contents of profile OneWayVisa is shown below:
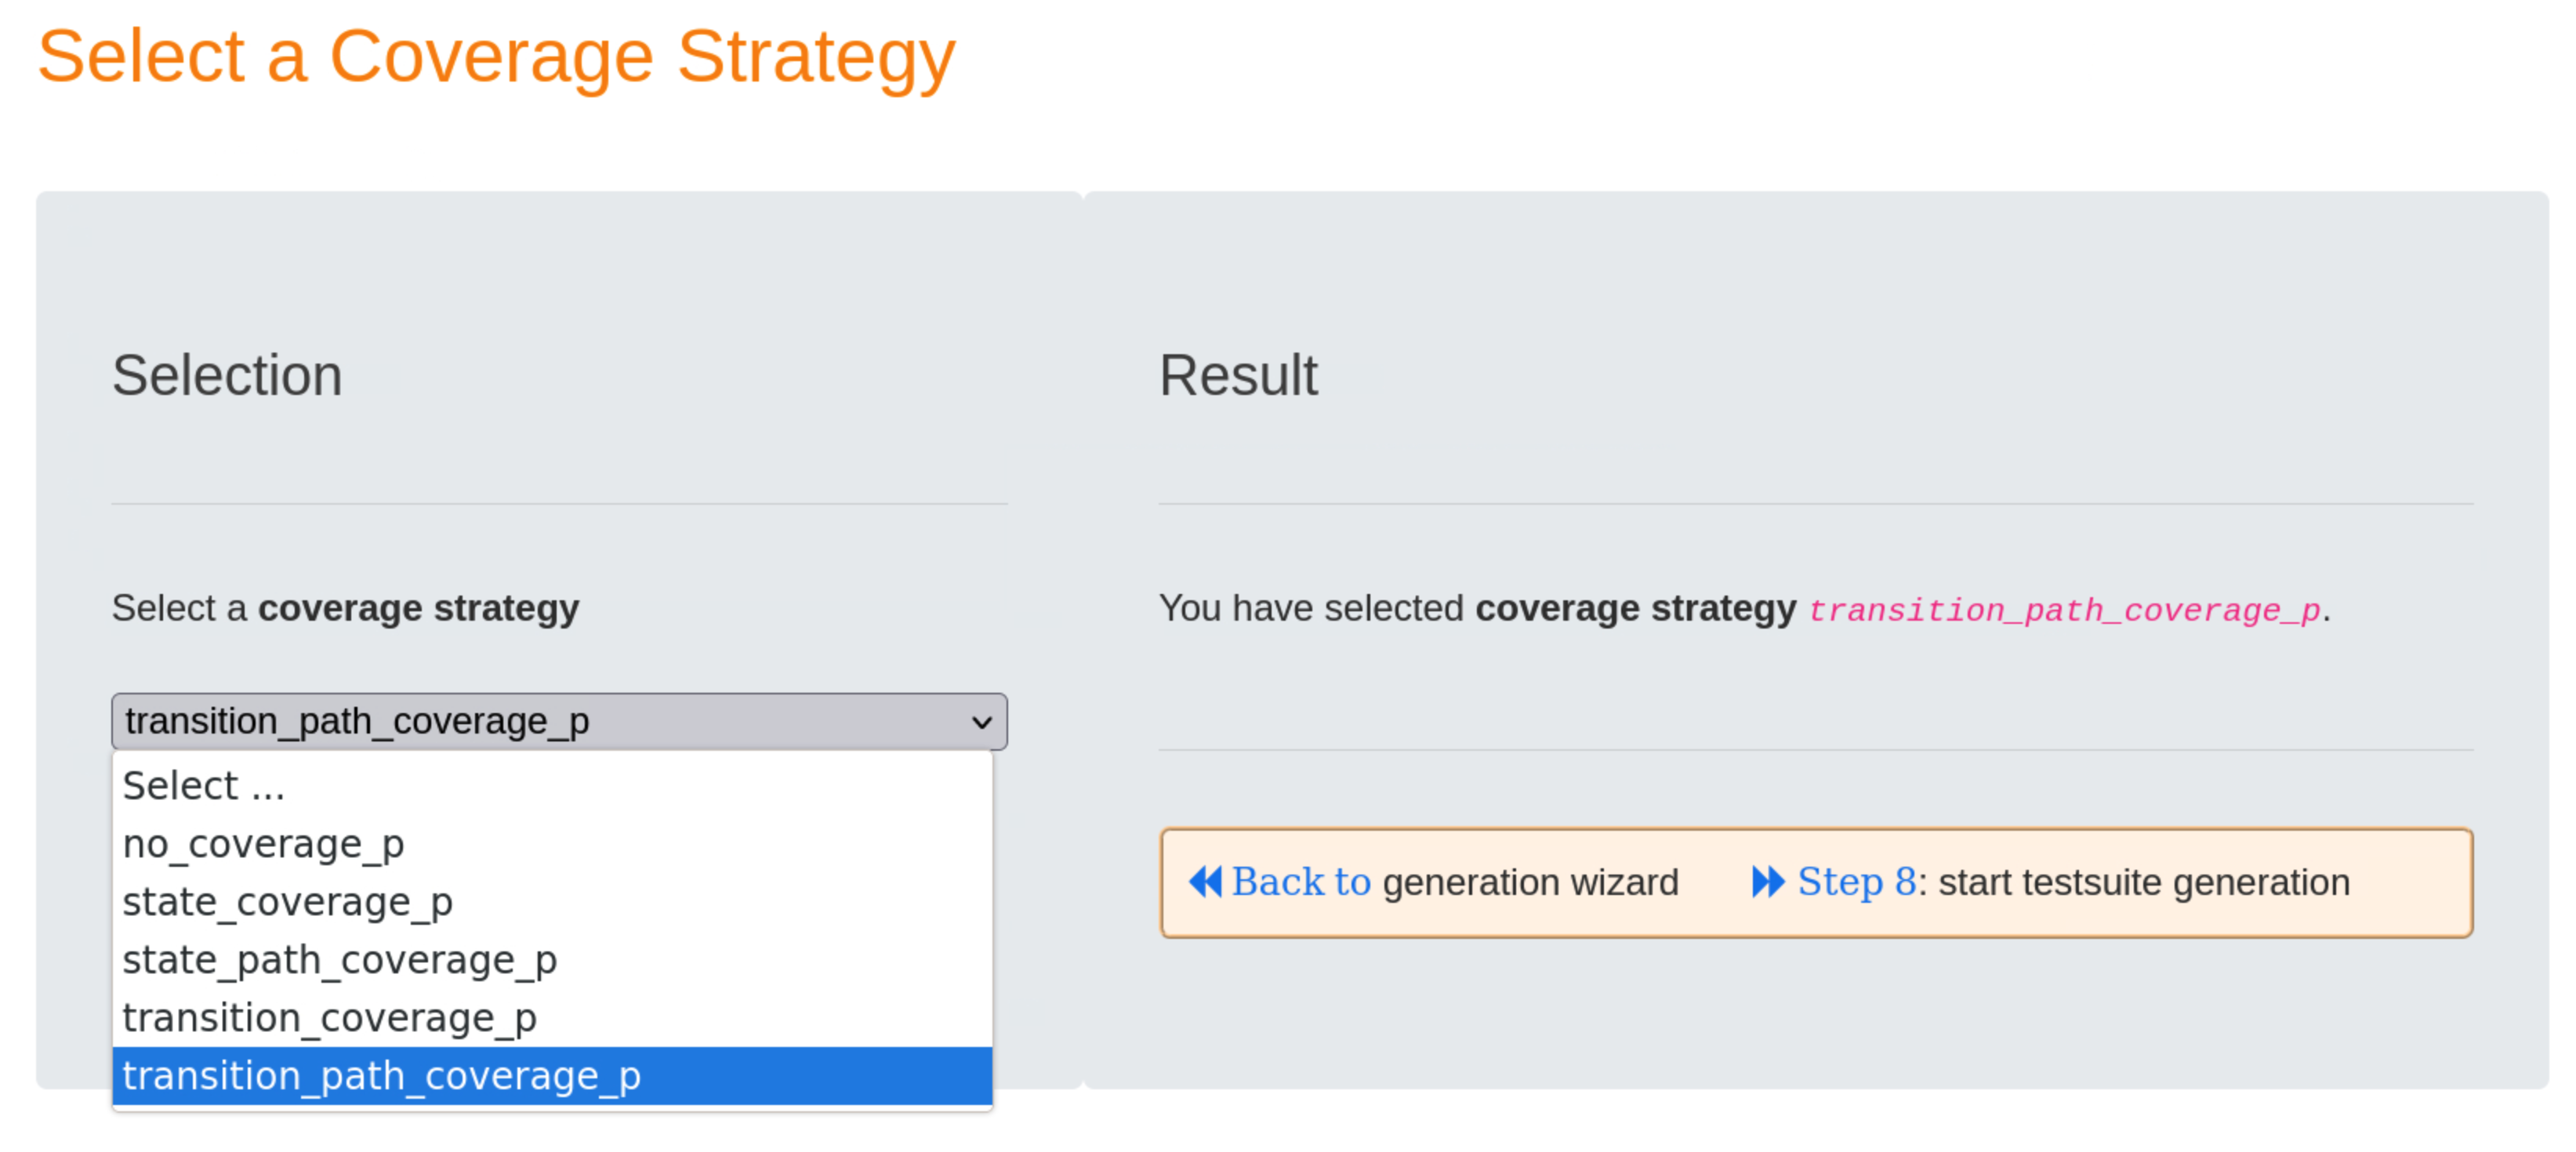
Step 5: select a coverage strategy
To ensure that all transitions are visited, and also to avoid any duplicate test steps, we choose the transition_path_coverage_p strategy in this step. The suffix _p indicates that a usage profile is used.
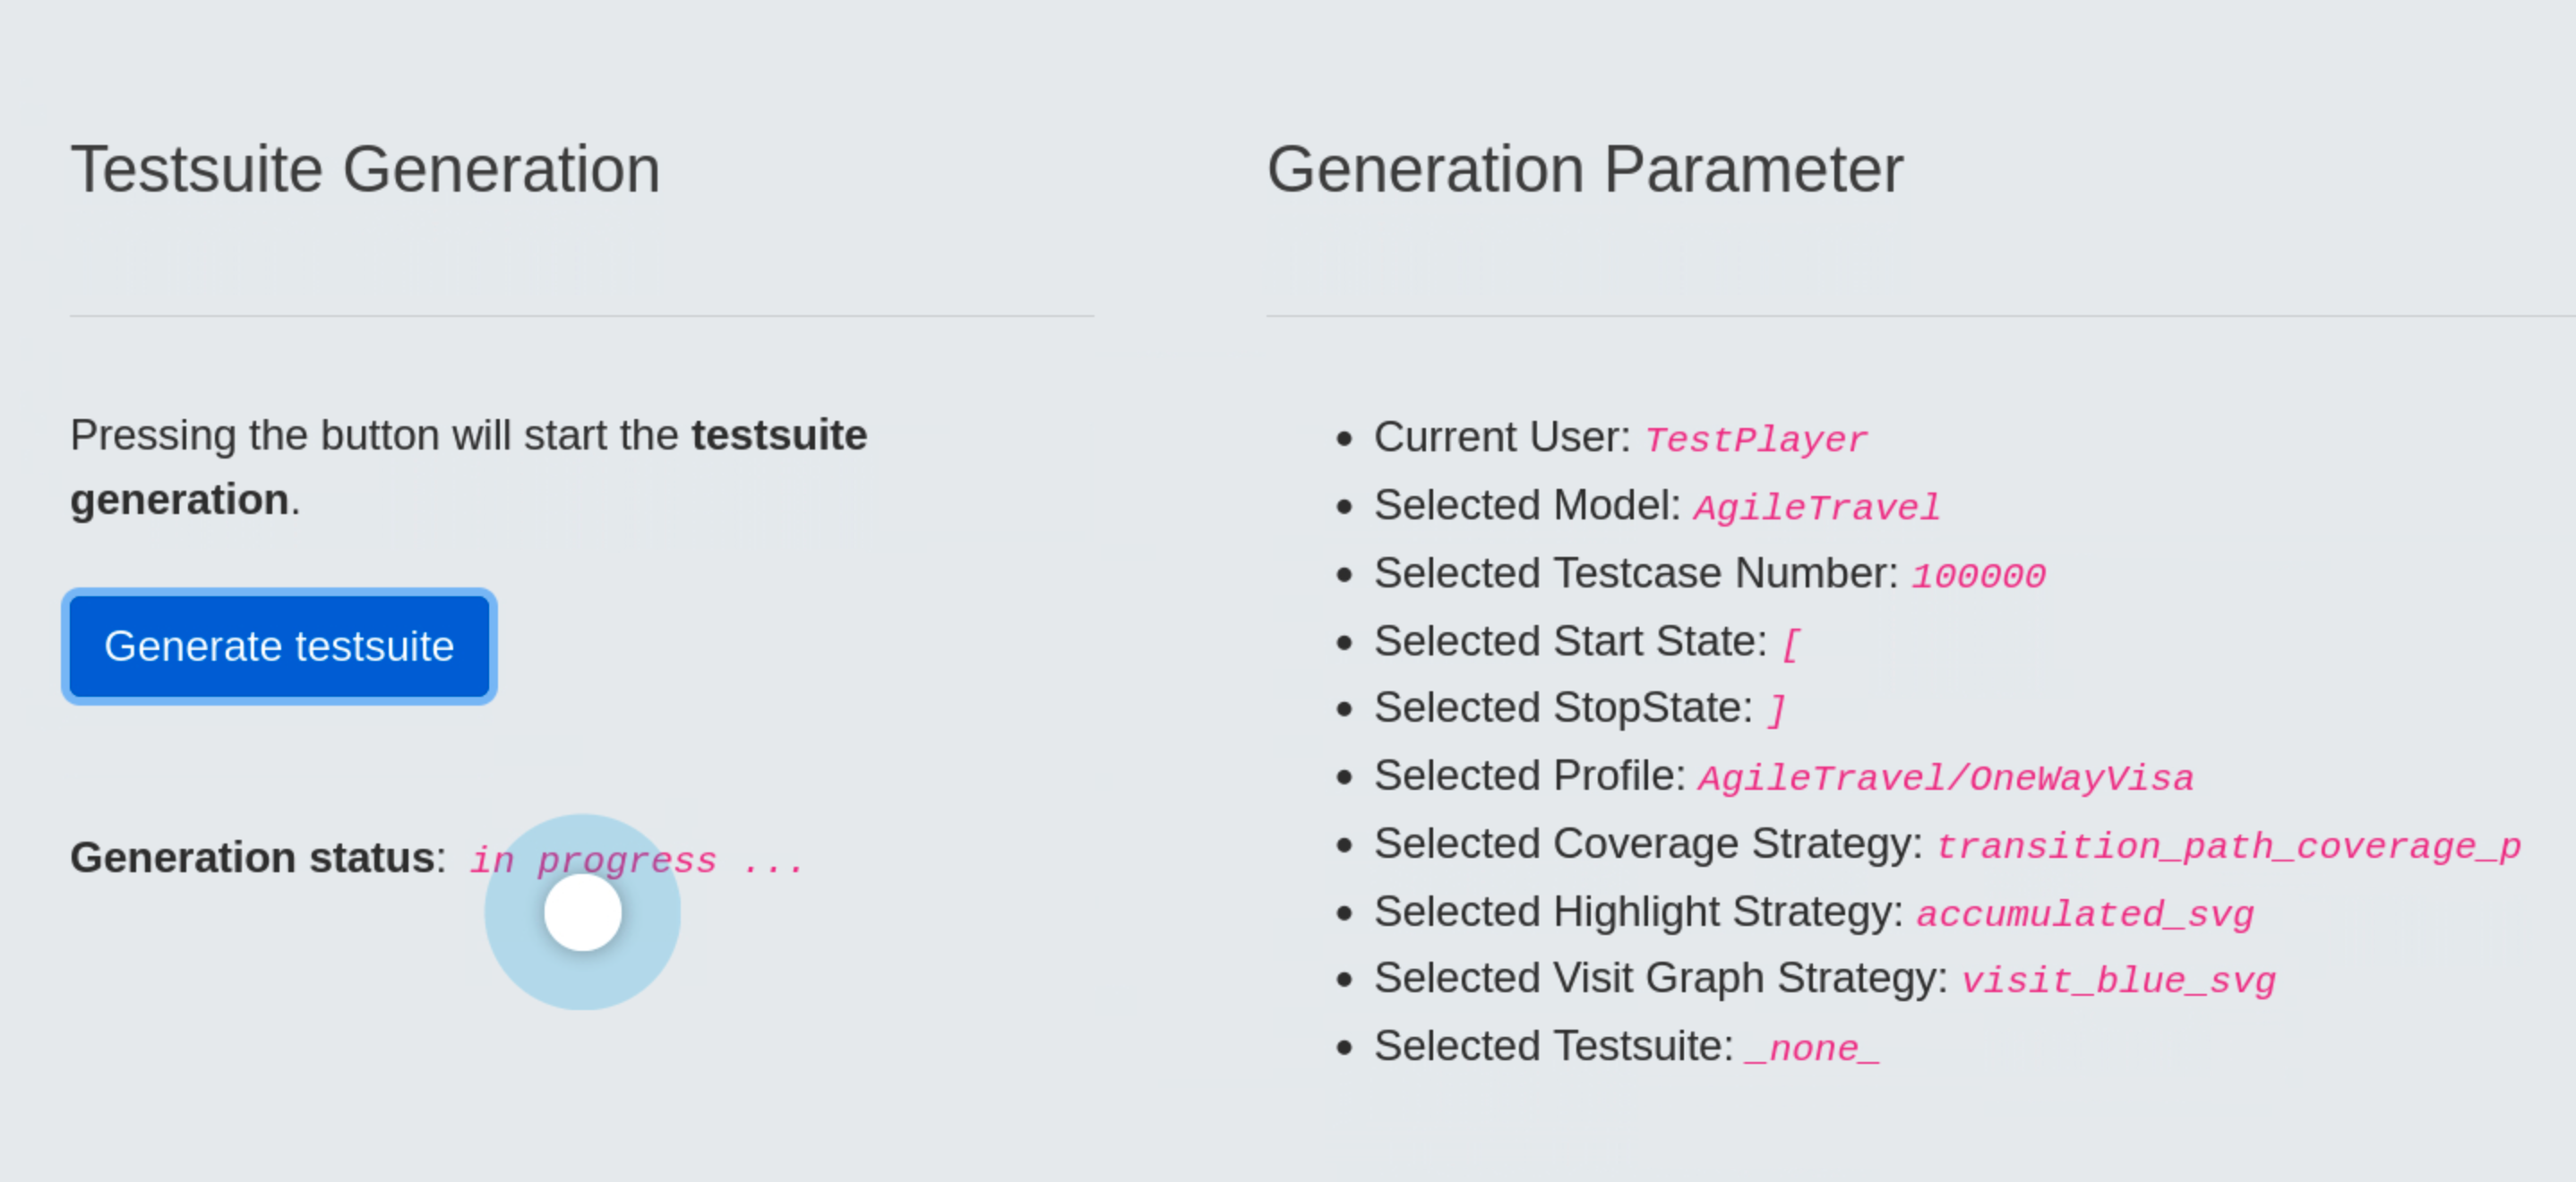
Step 8: show current values of the generation parameters and start the test suite generation
In the Generation Parameter area we validate the selected parameter values and start the generation afterwards by pressing the blue Generate testsuite button.
Visualization of the Test Suite
Visualization of test cases and the resulting test coverage
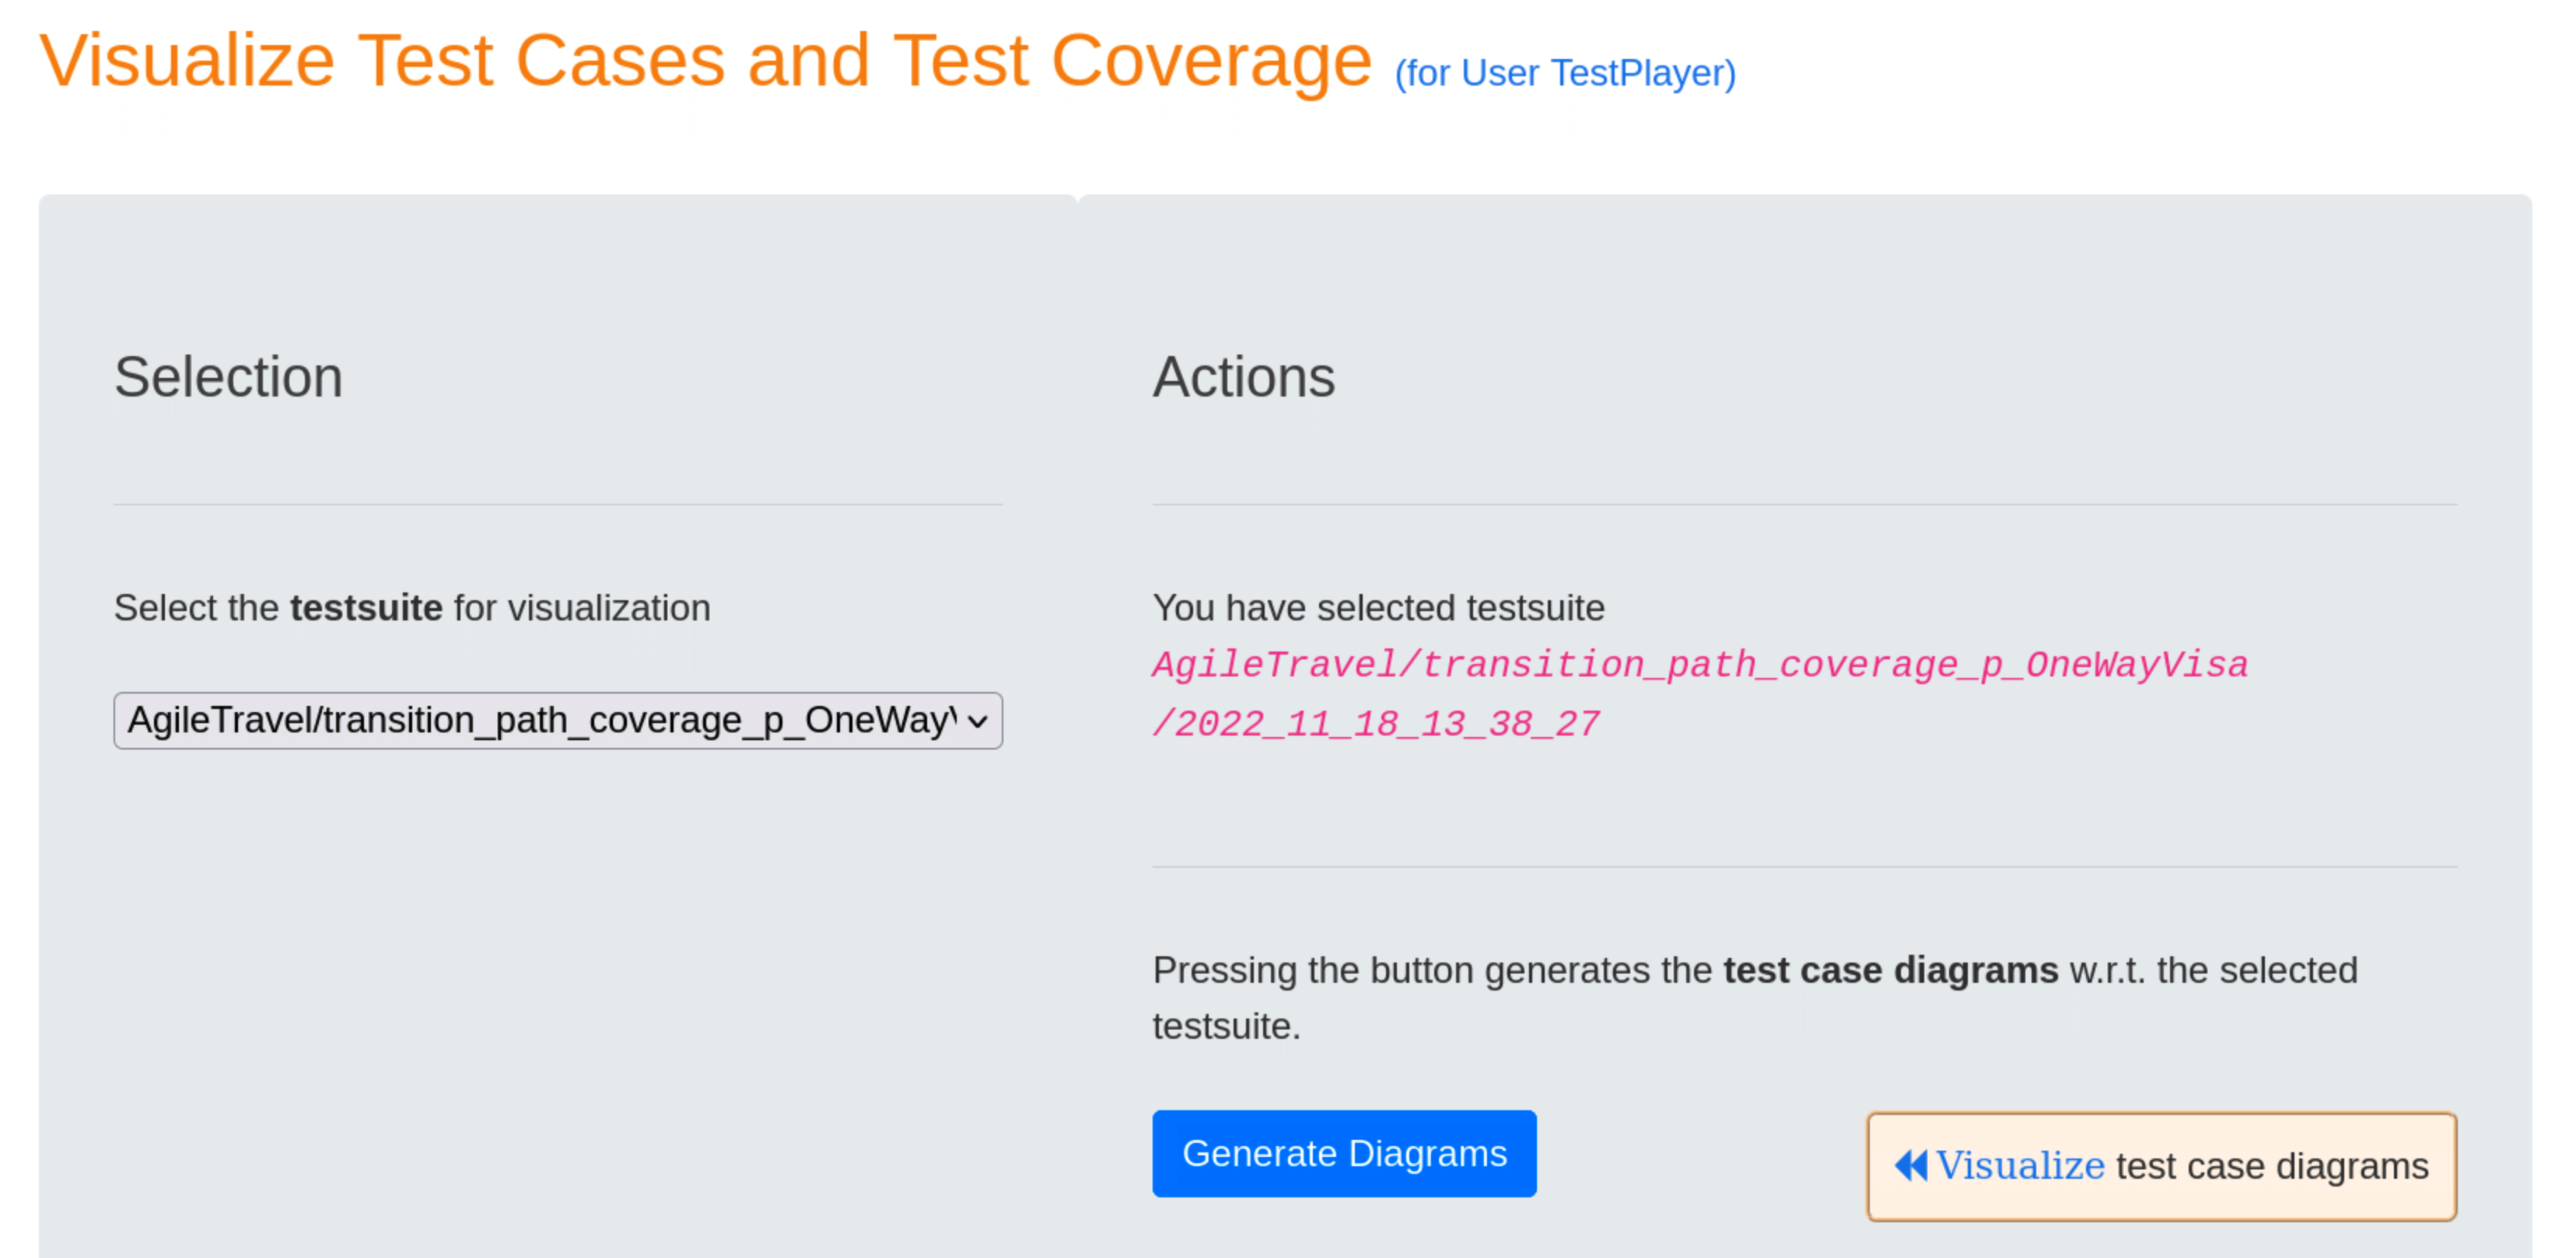
Pressing the blue Generate Diagrams button, TestPlayer generates a series of diagrams that are displayed when the « Visualize test case diagrams link is selected.
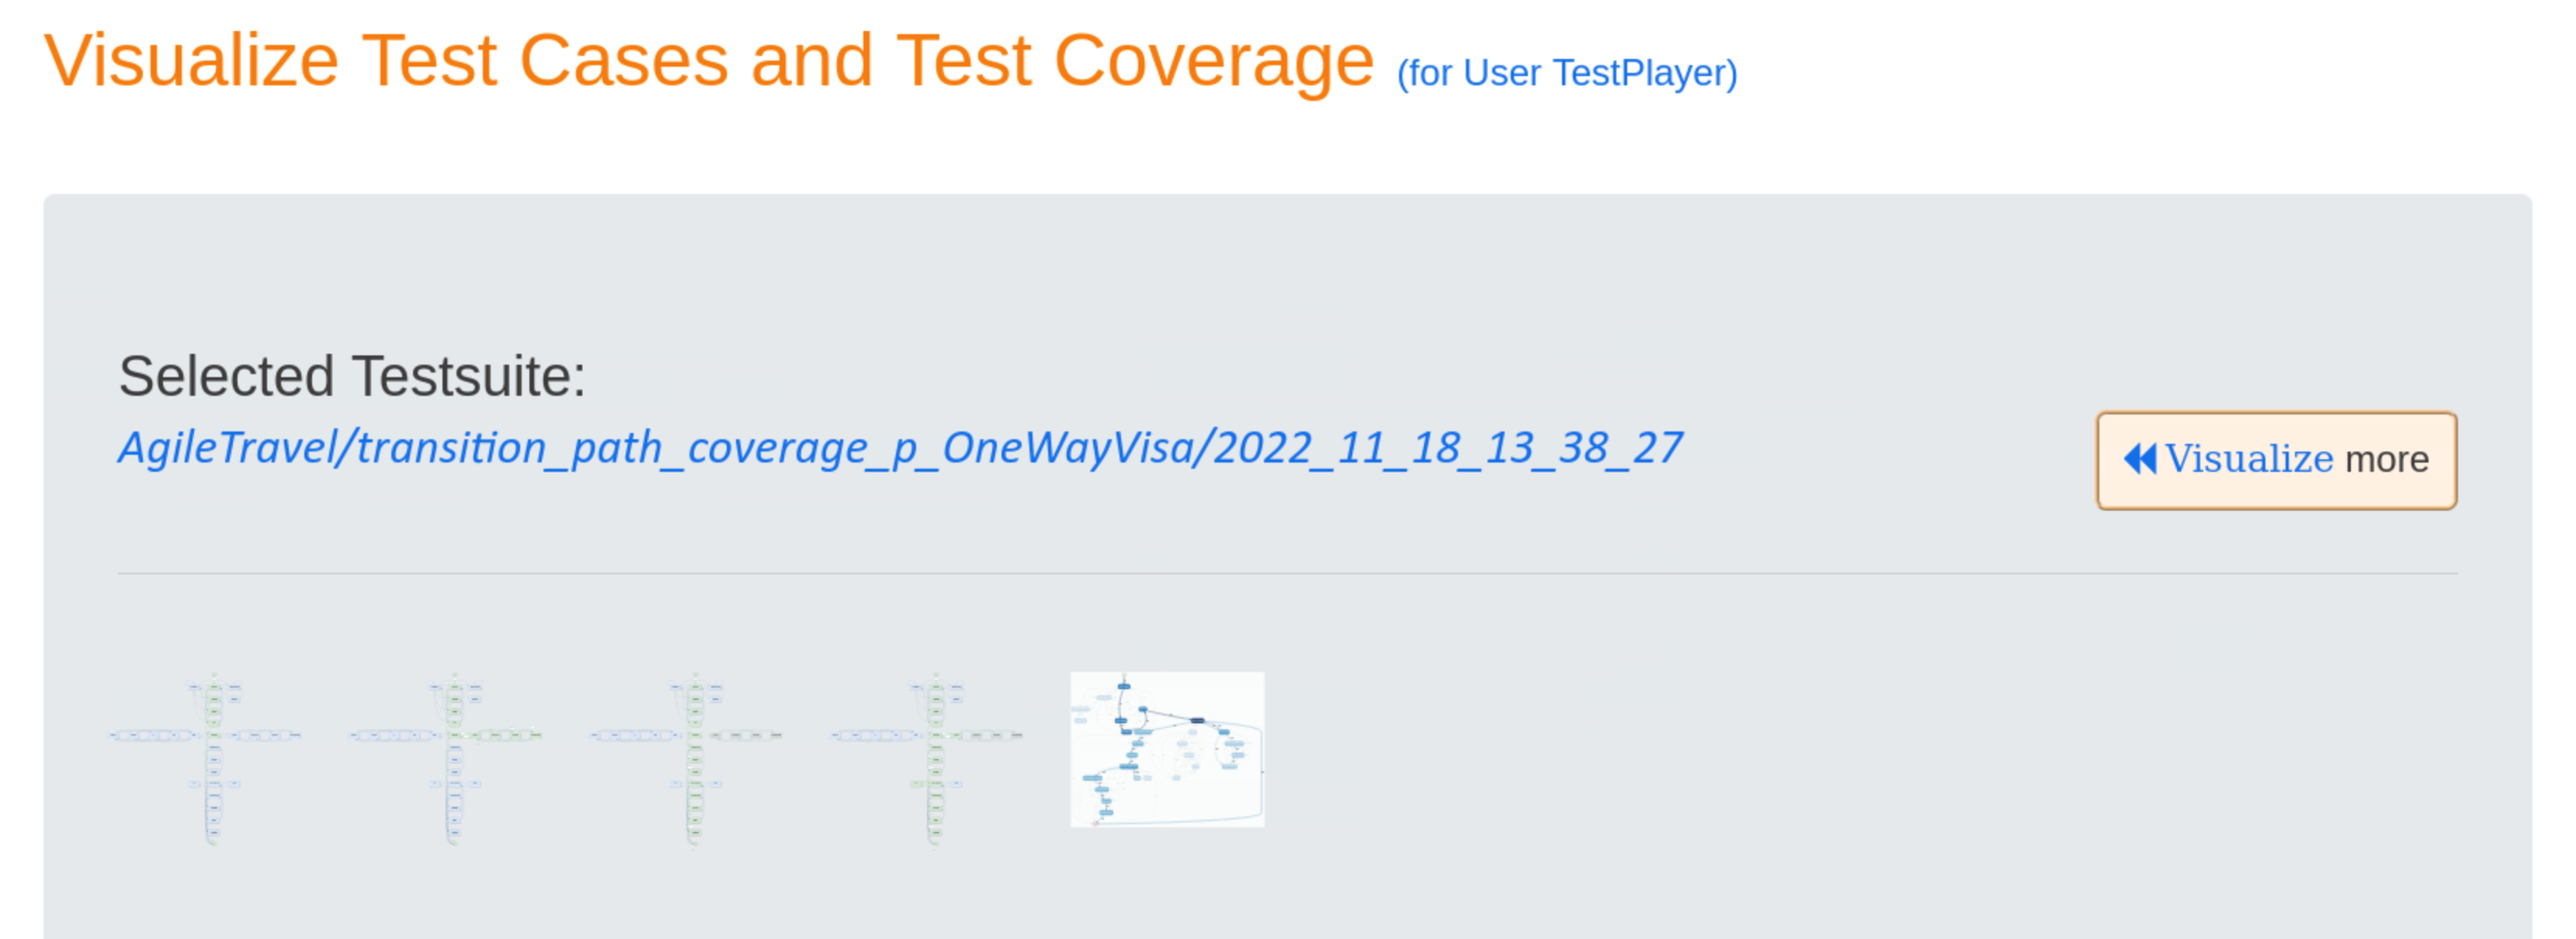
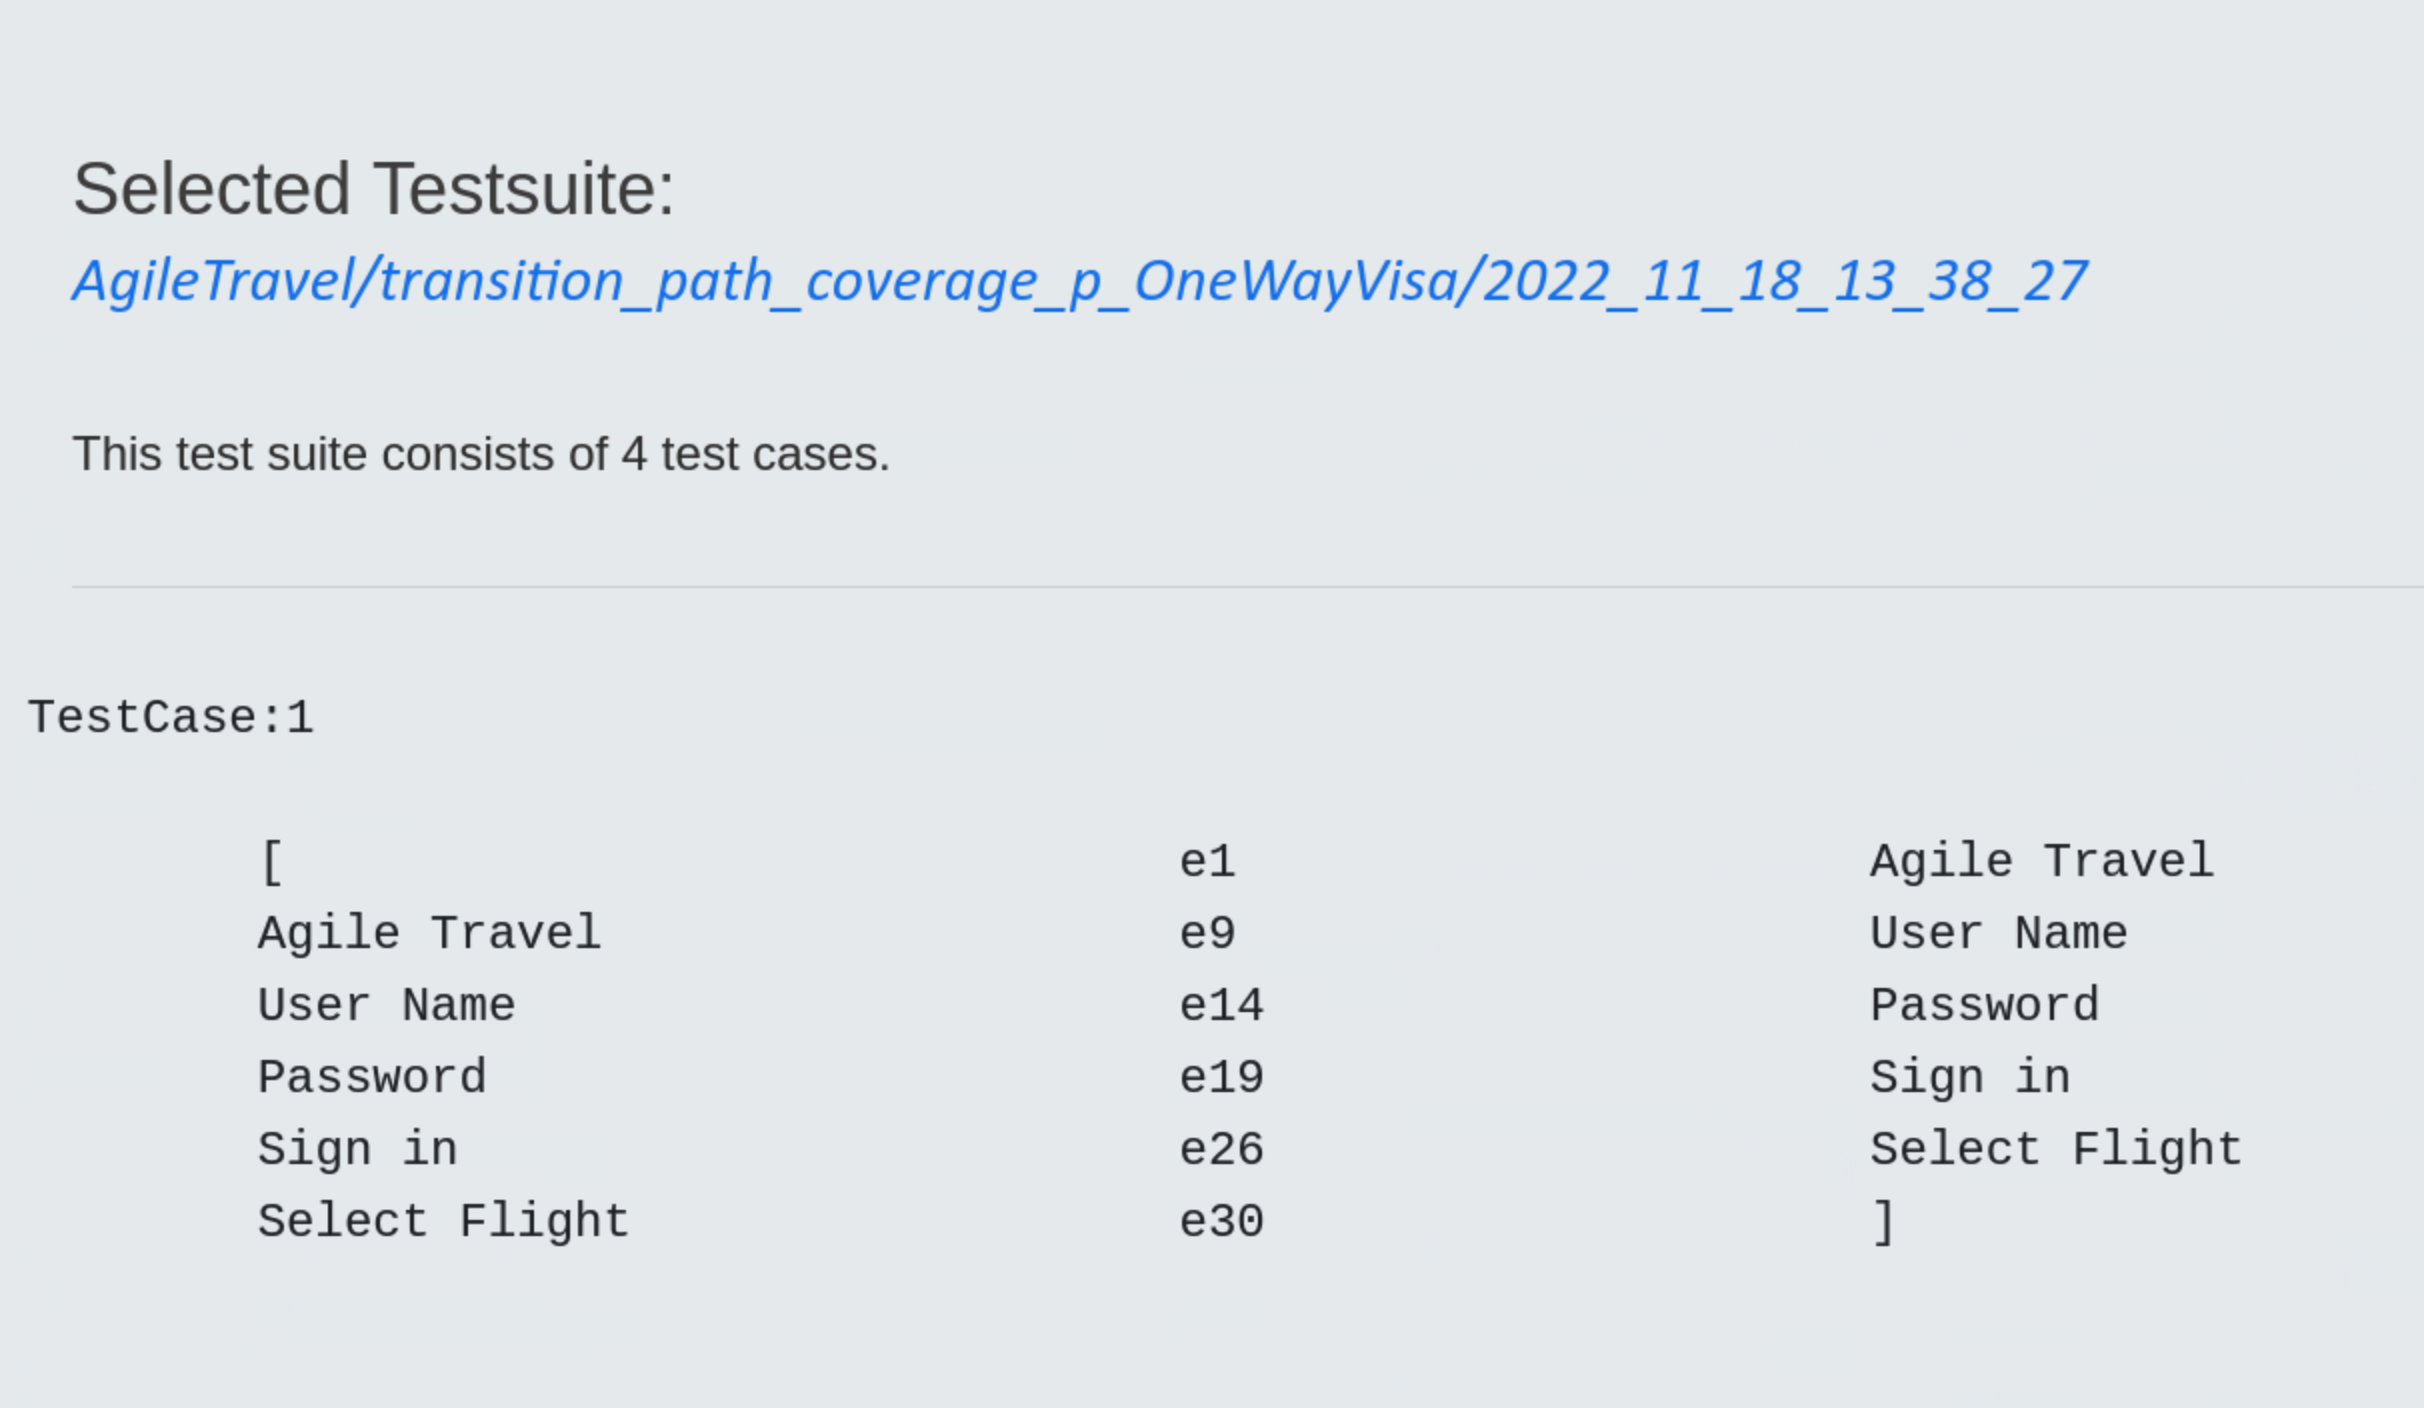
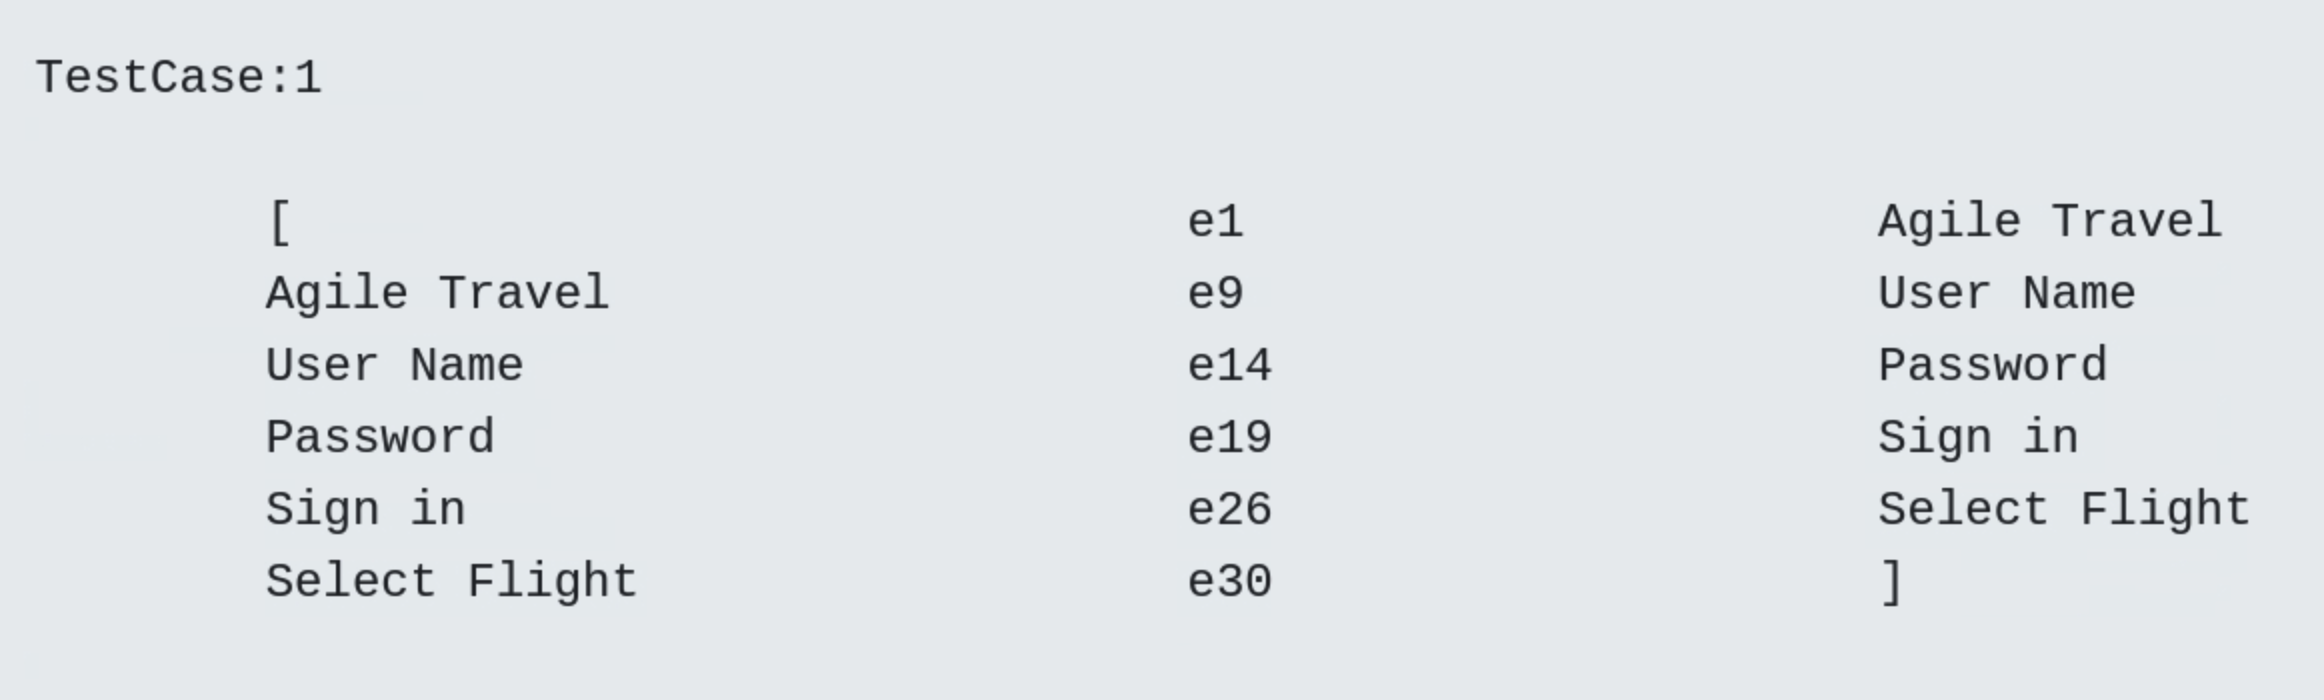
All four test cases of the adapted test suite are shown below. As can be seen at the end, all usage states and transitions of the adjusted model region are covered and visited at least once.
- Test Case 1

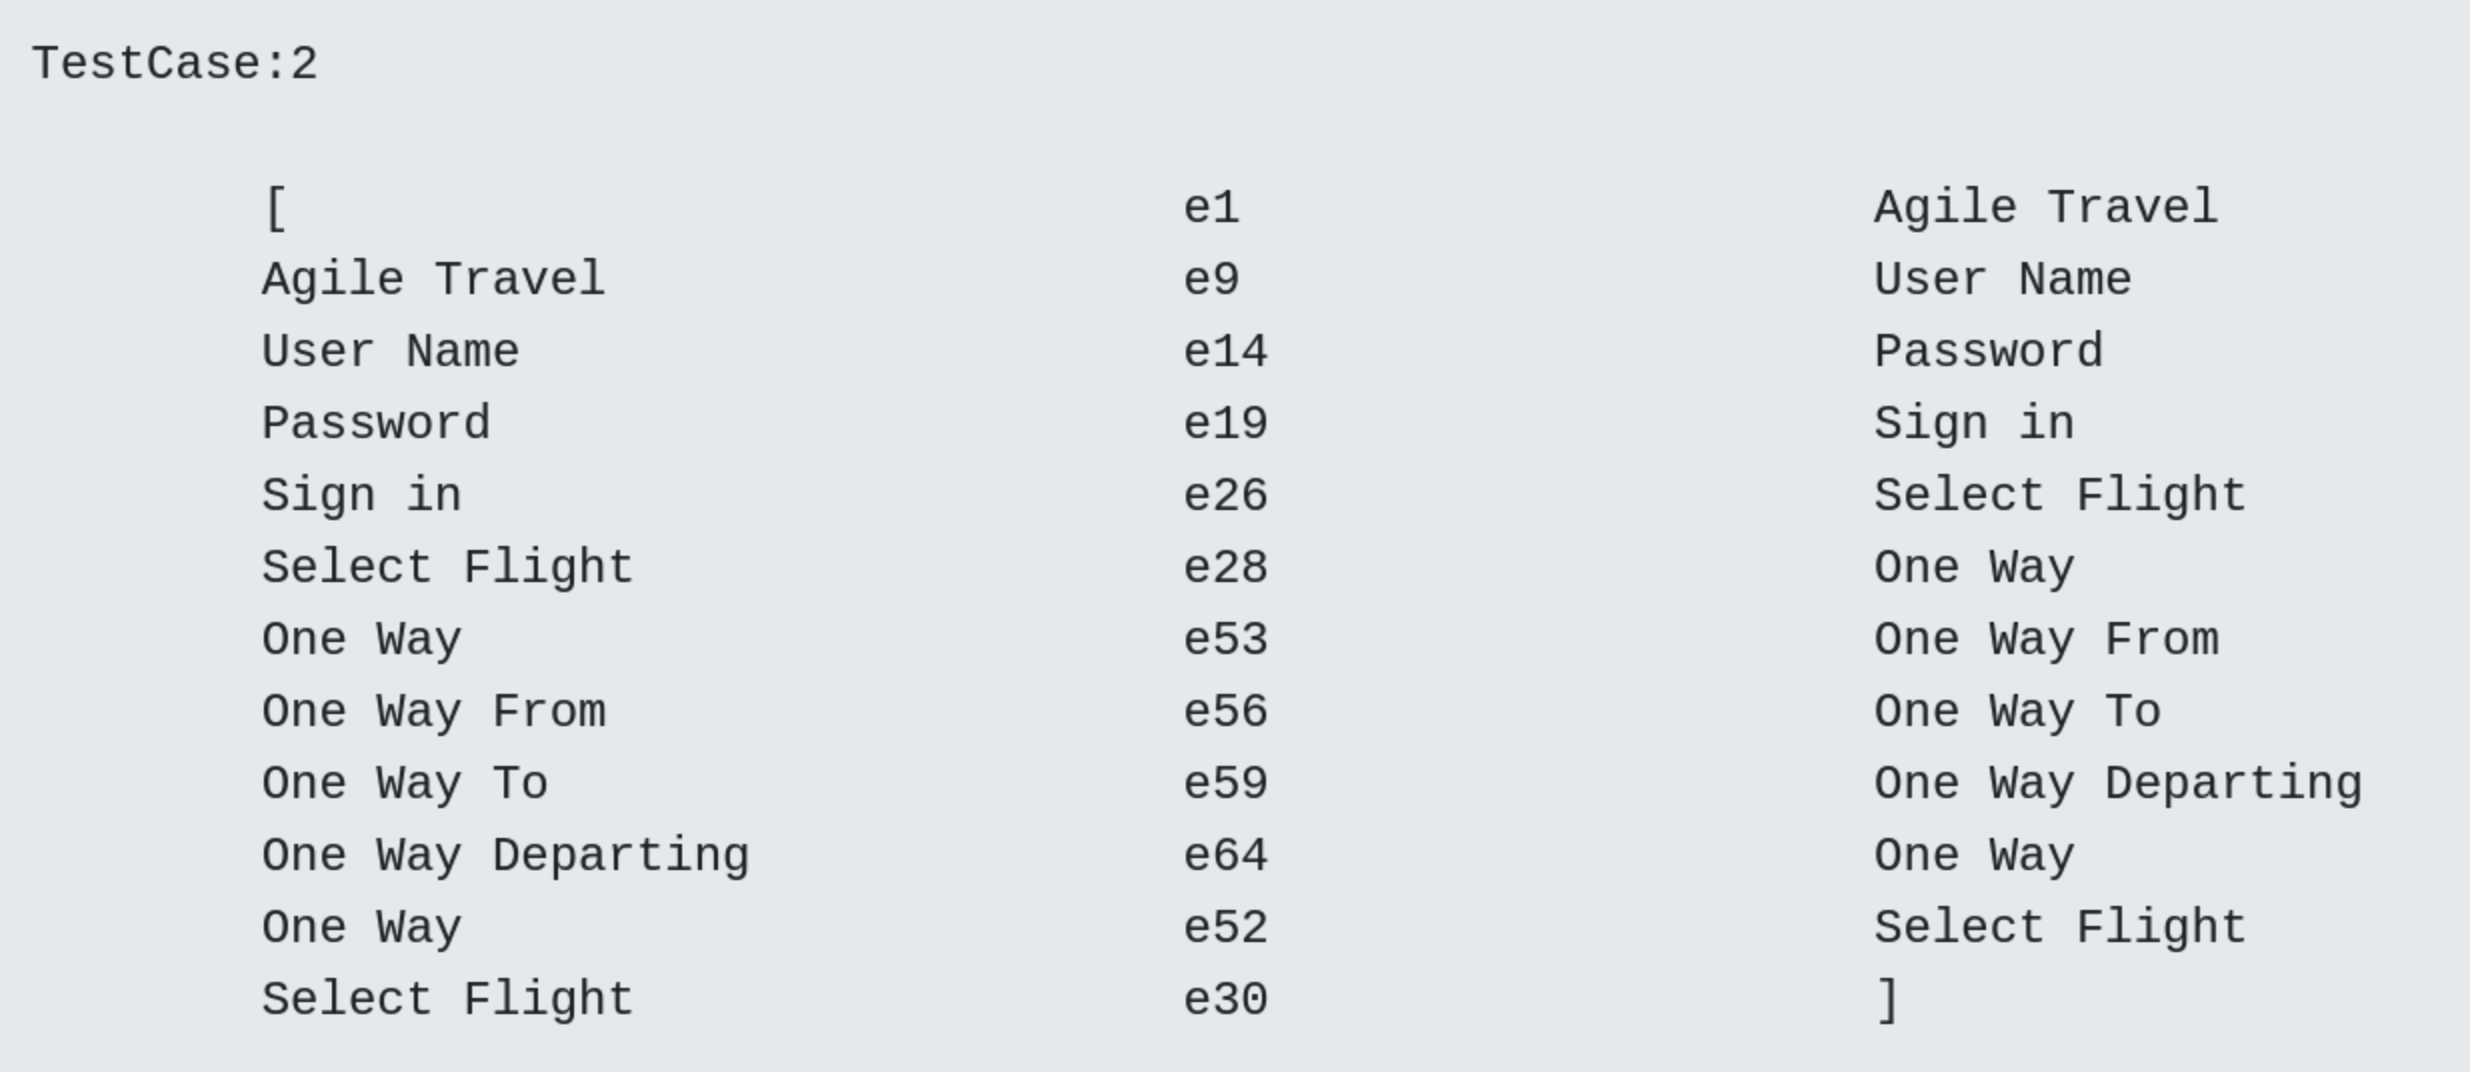
- Test Case 2

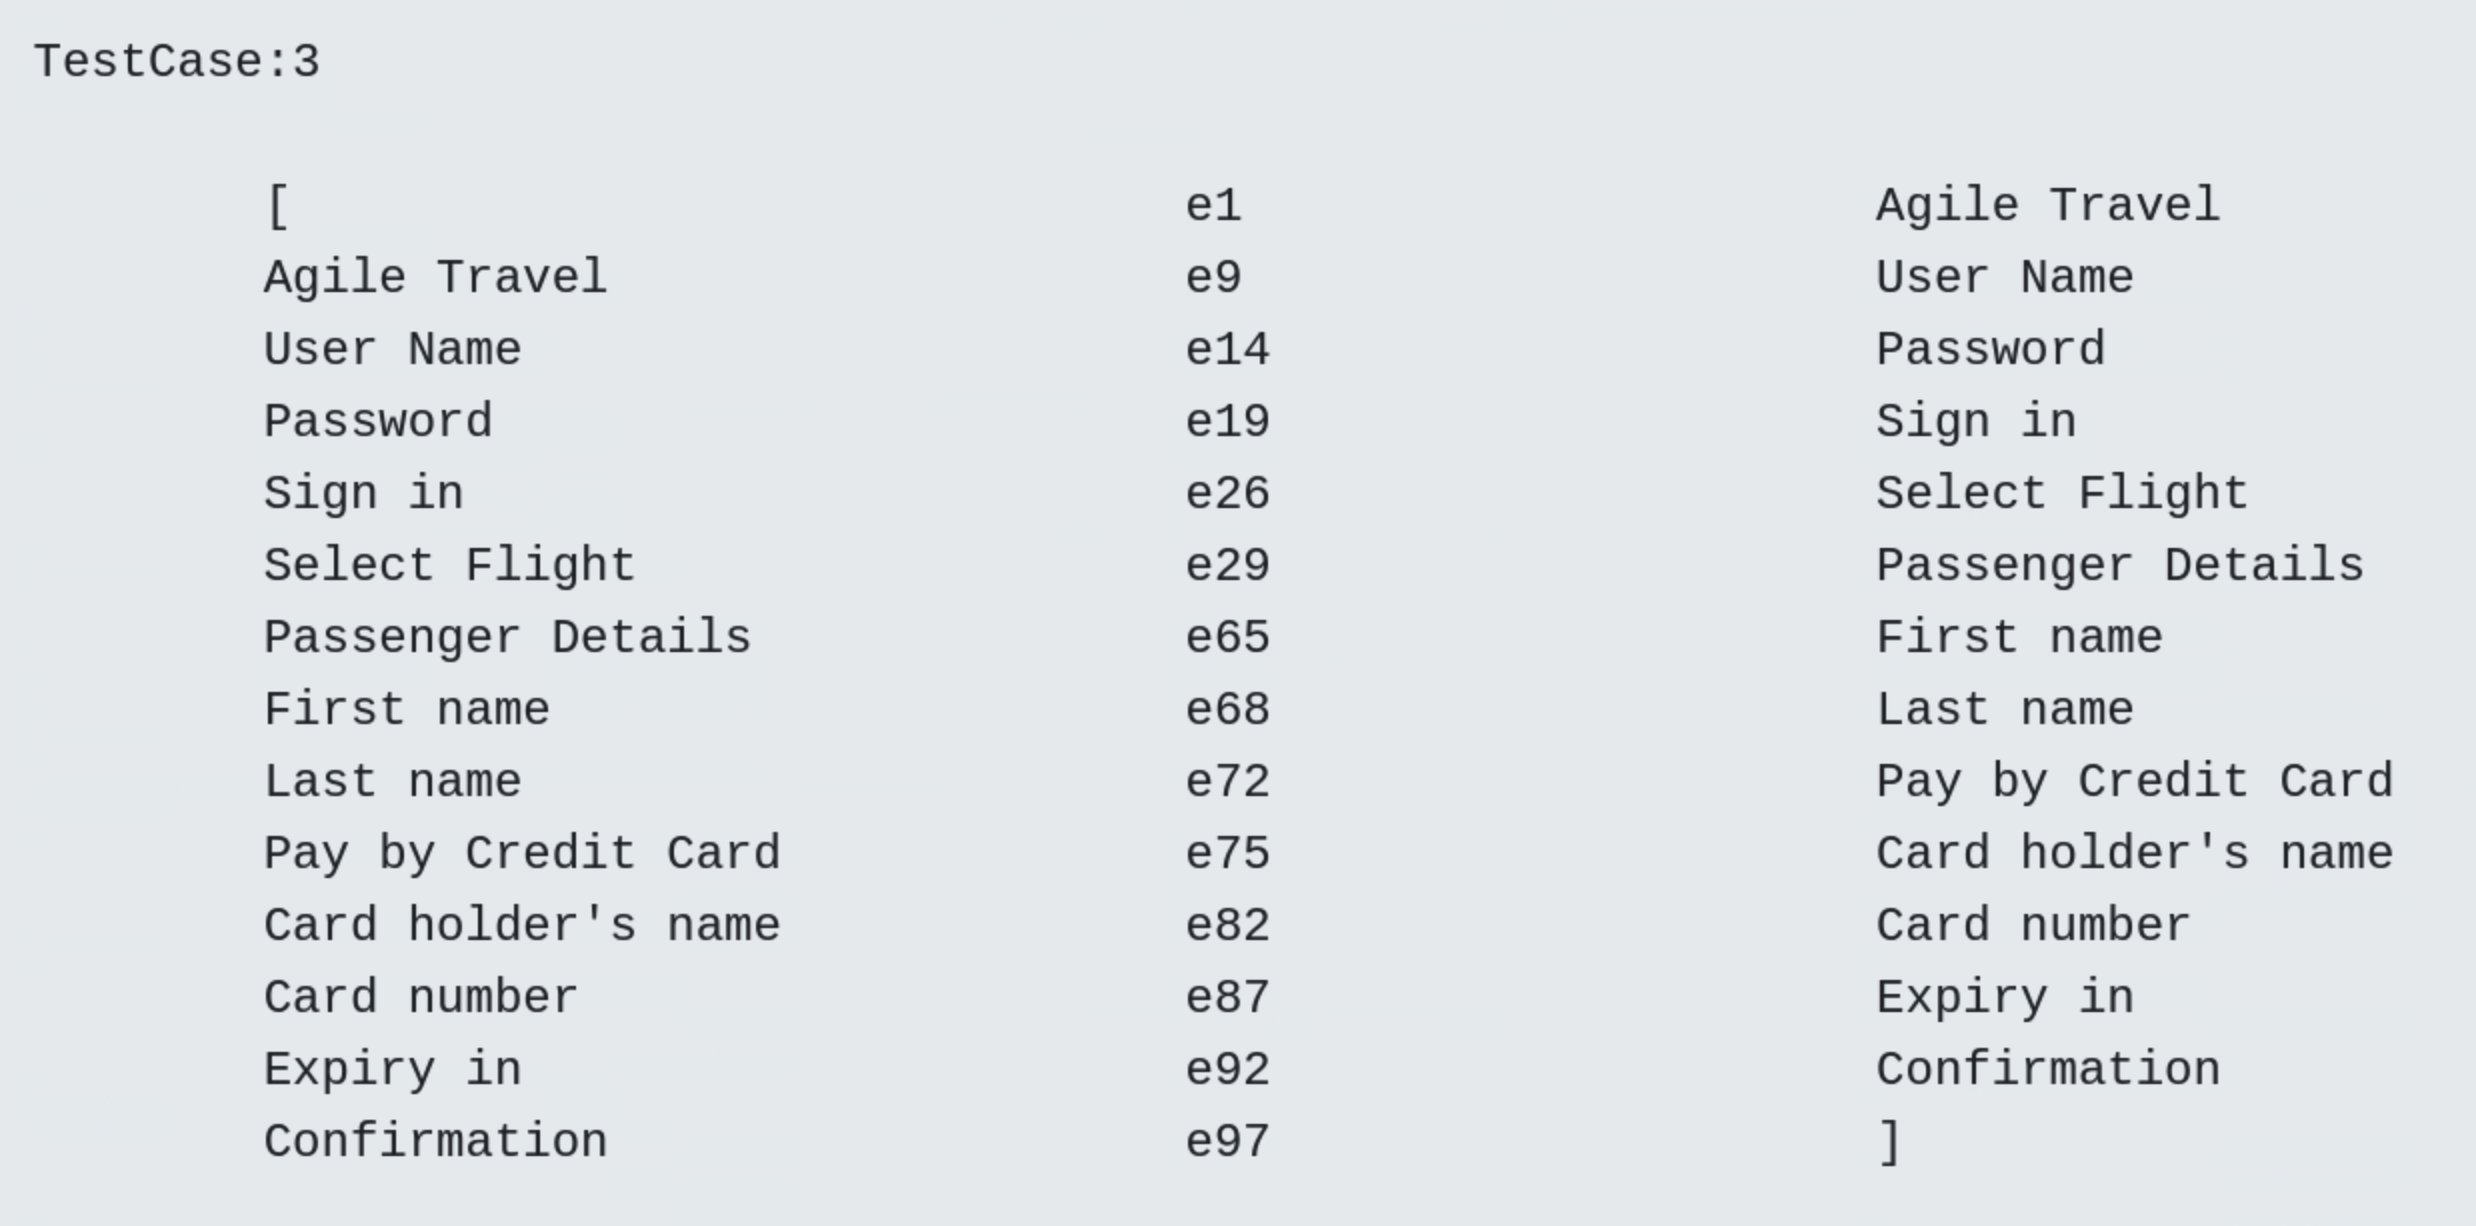
- Test Case 3

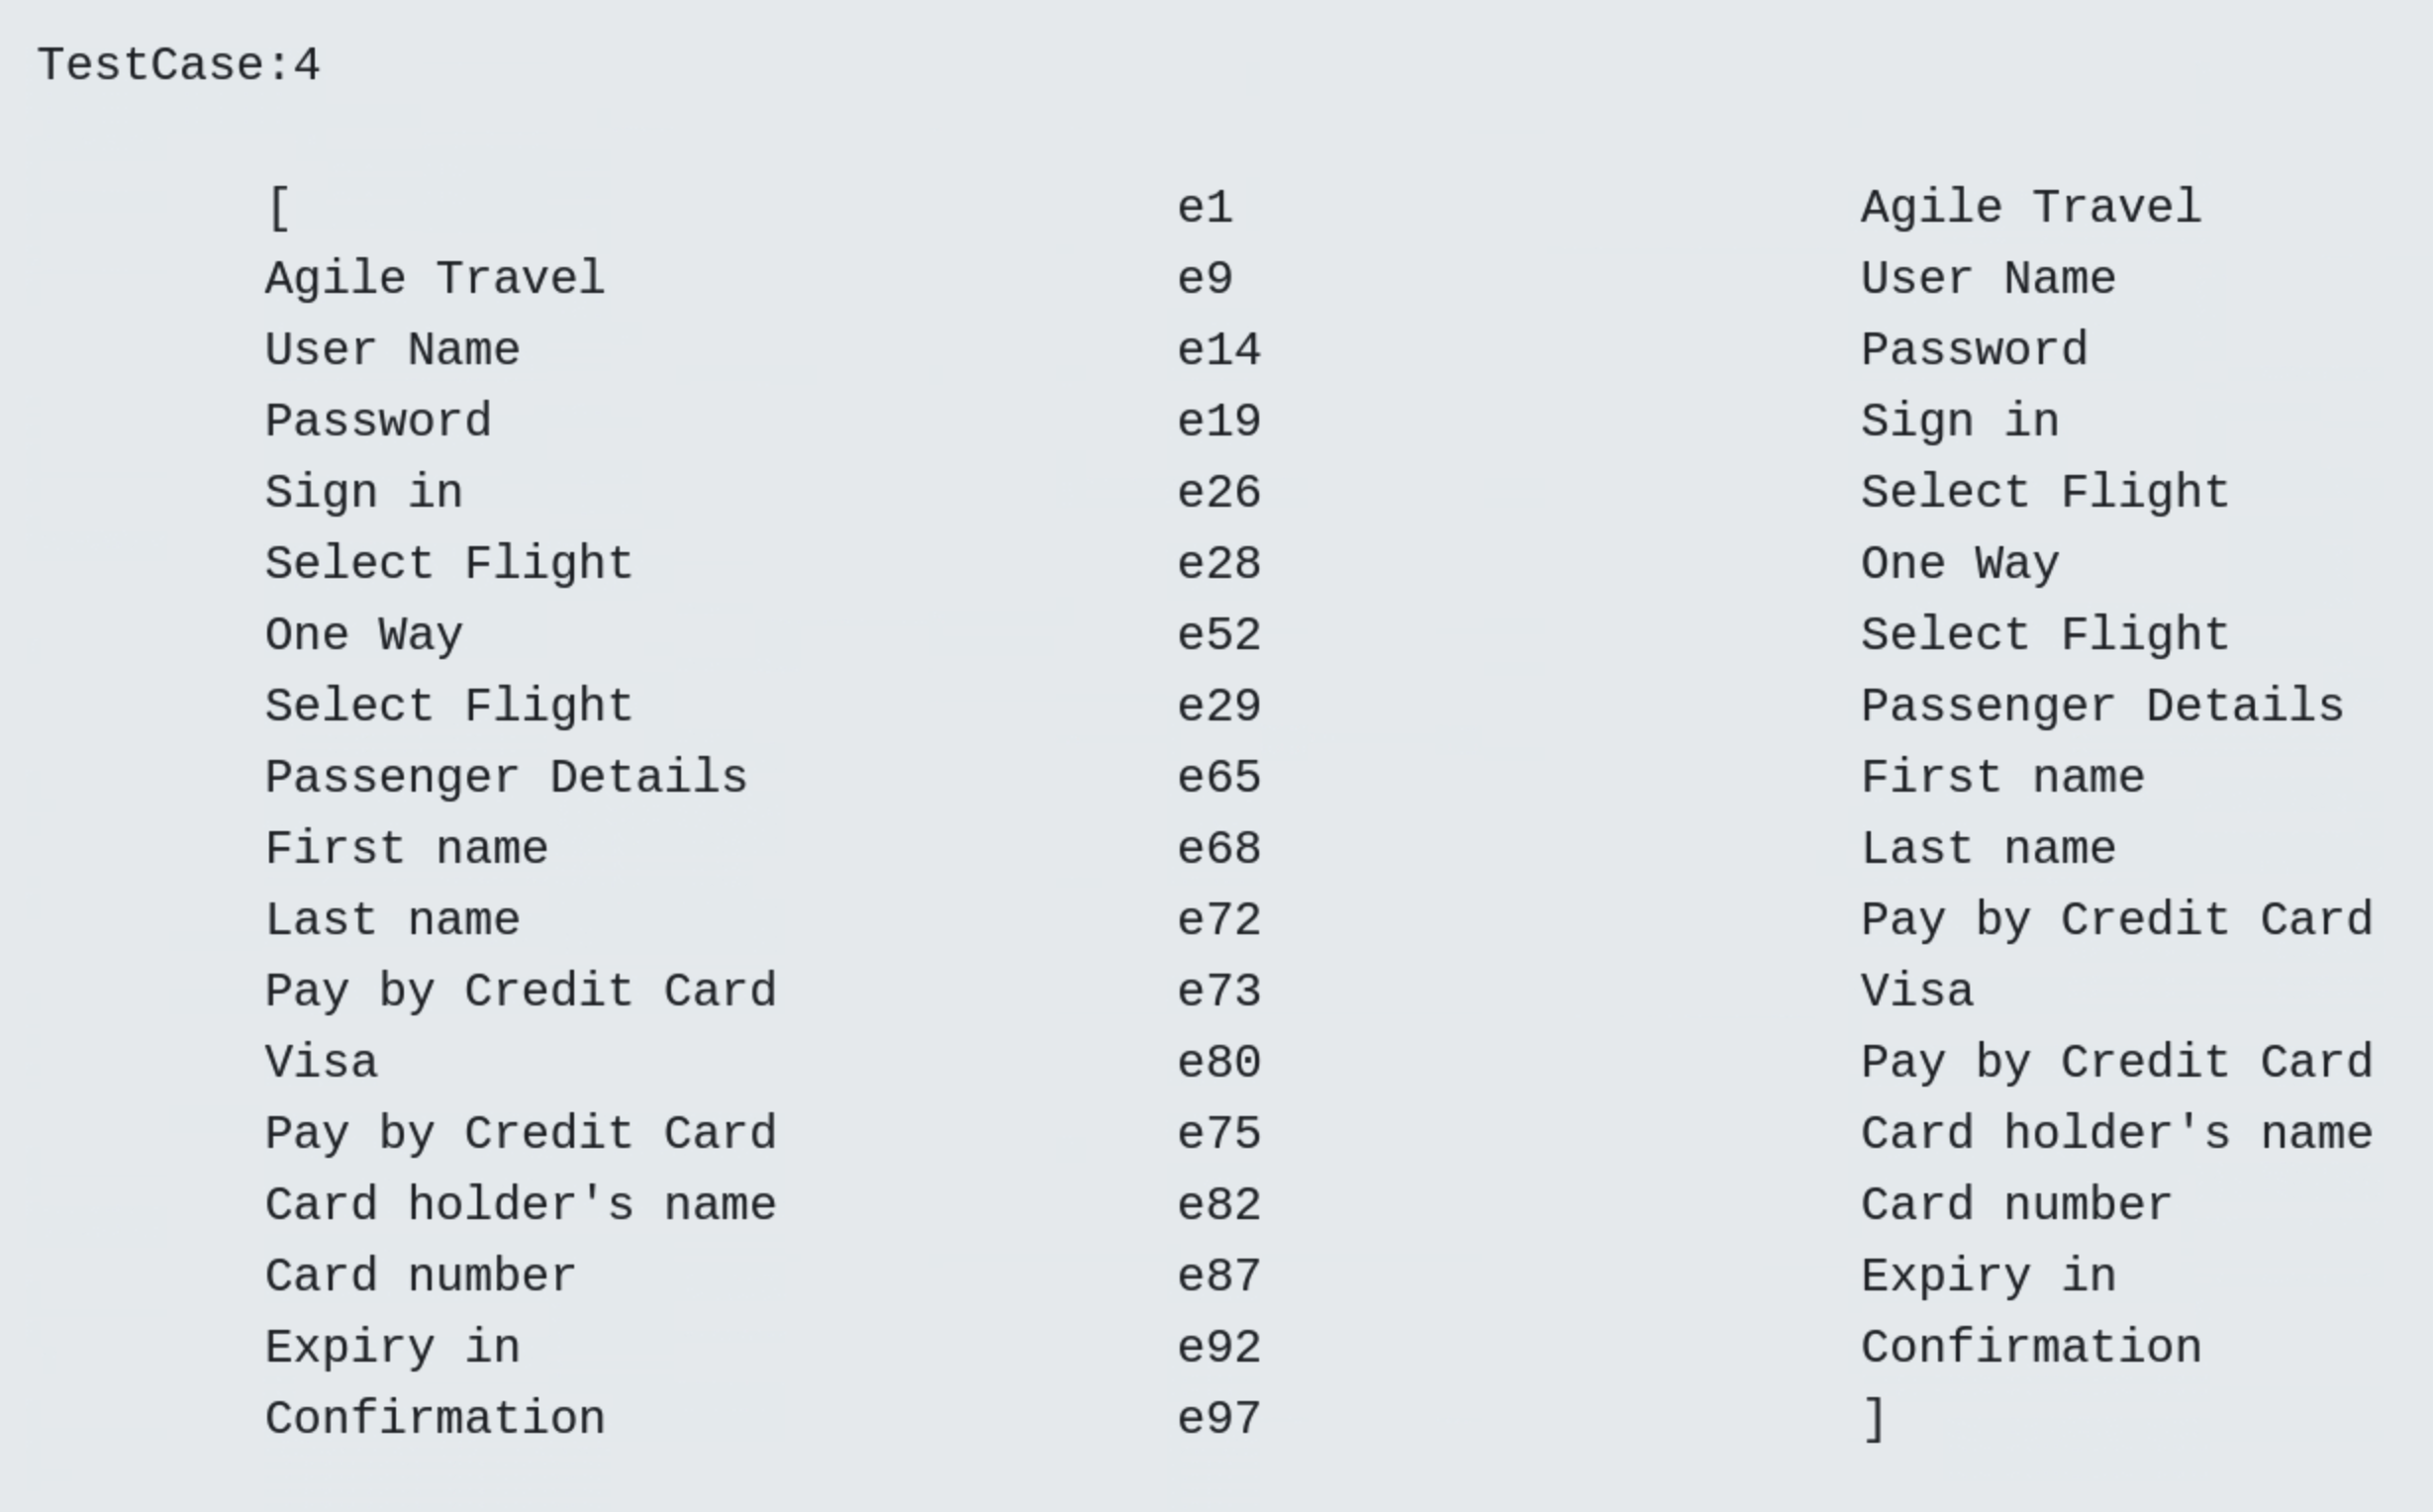
- Test Case 4

- Frequency diagram
In the frequency plot, the darkness of the blue colour indicates the frequency of the visited model region, i.e. the darker the colour, the more visits. For example usage state
Select Flightis visited more often thanOne Way. The light gray color indicates the other parts of the model that are not visited during the test. It can be seen that the usage statesReturnandMasterare not visted as desired.

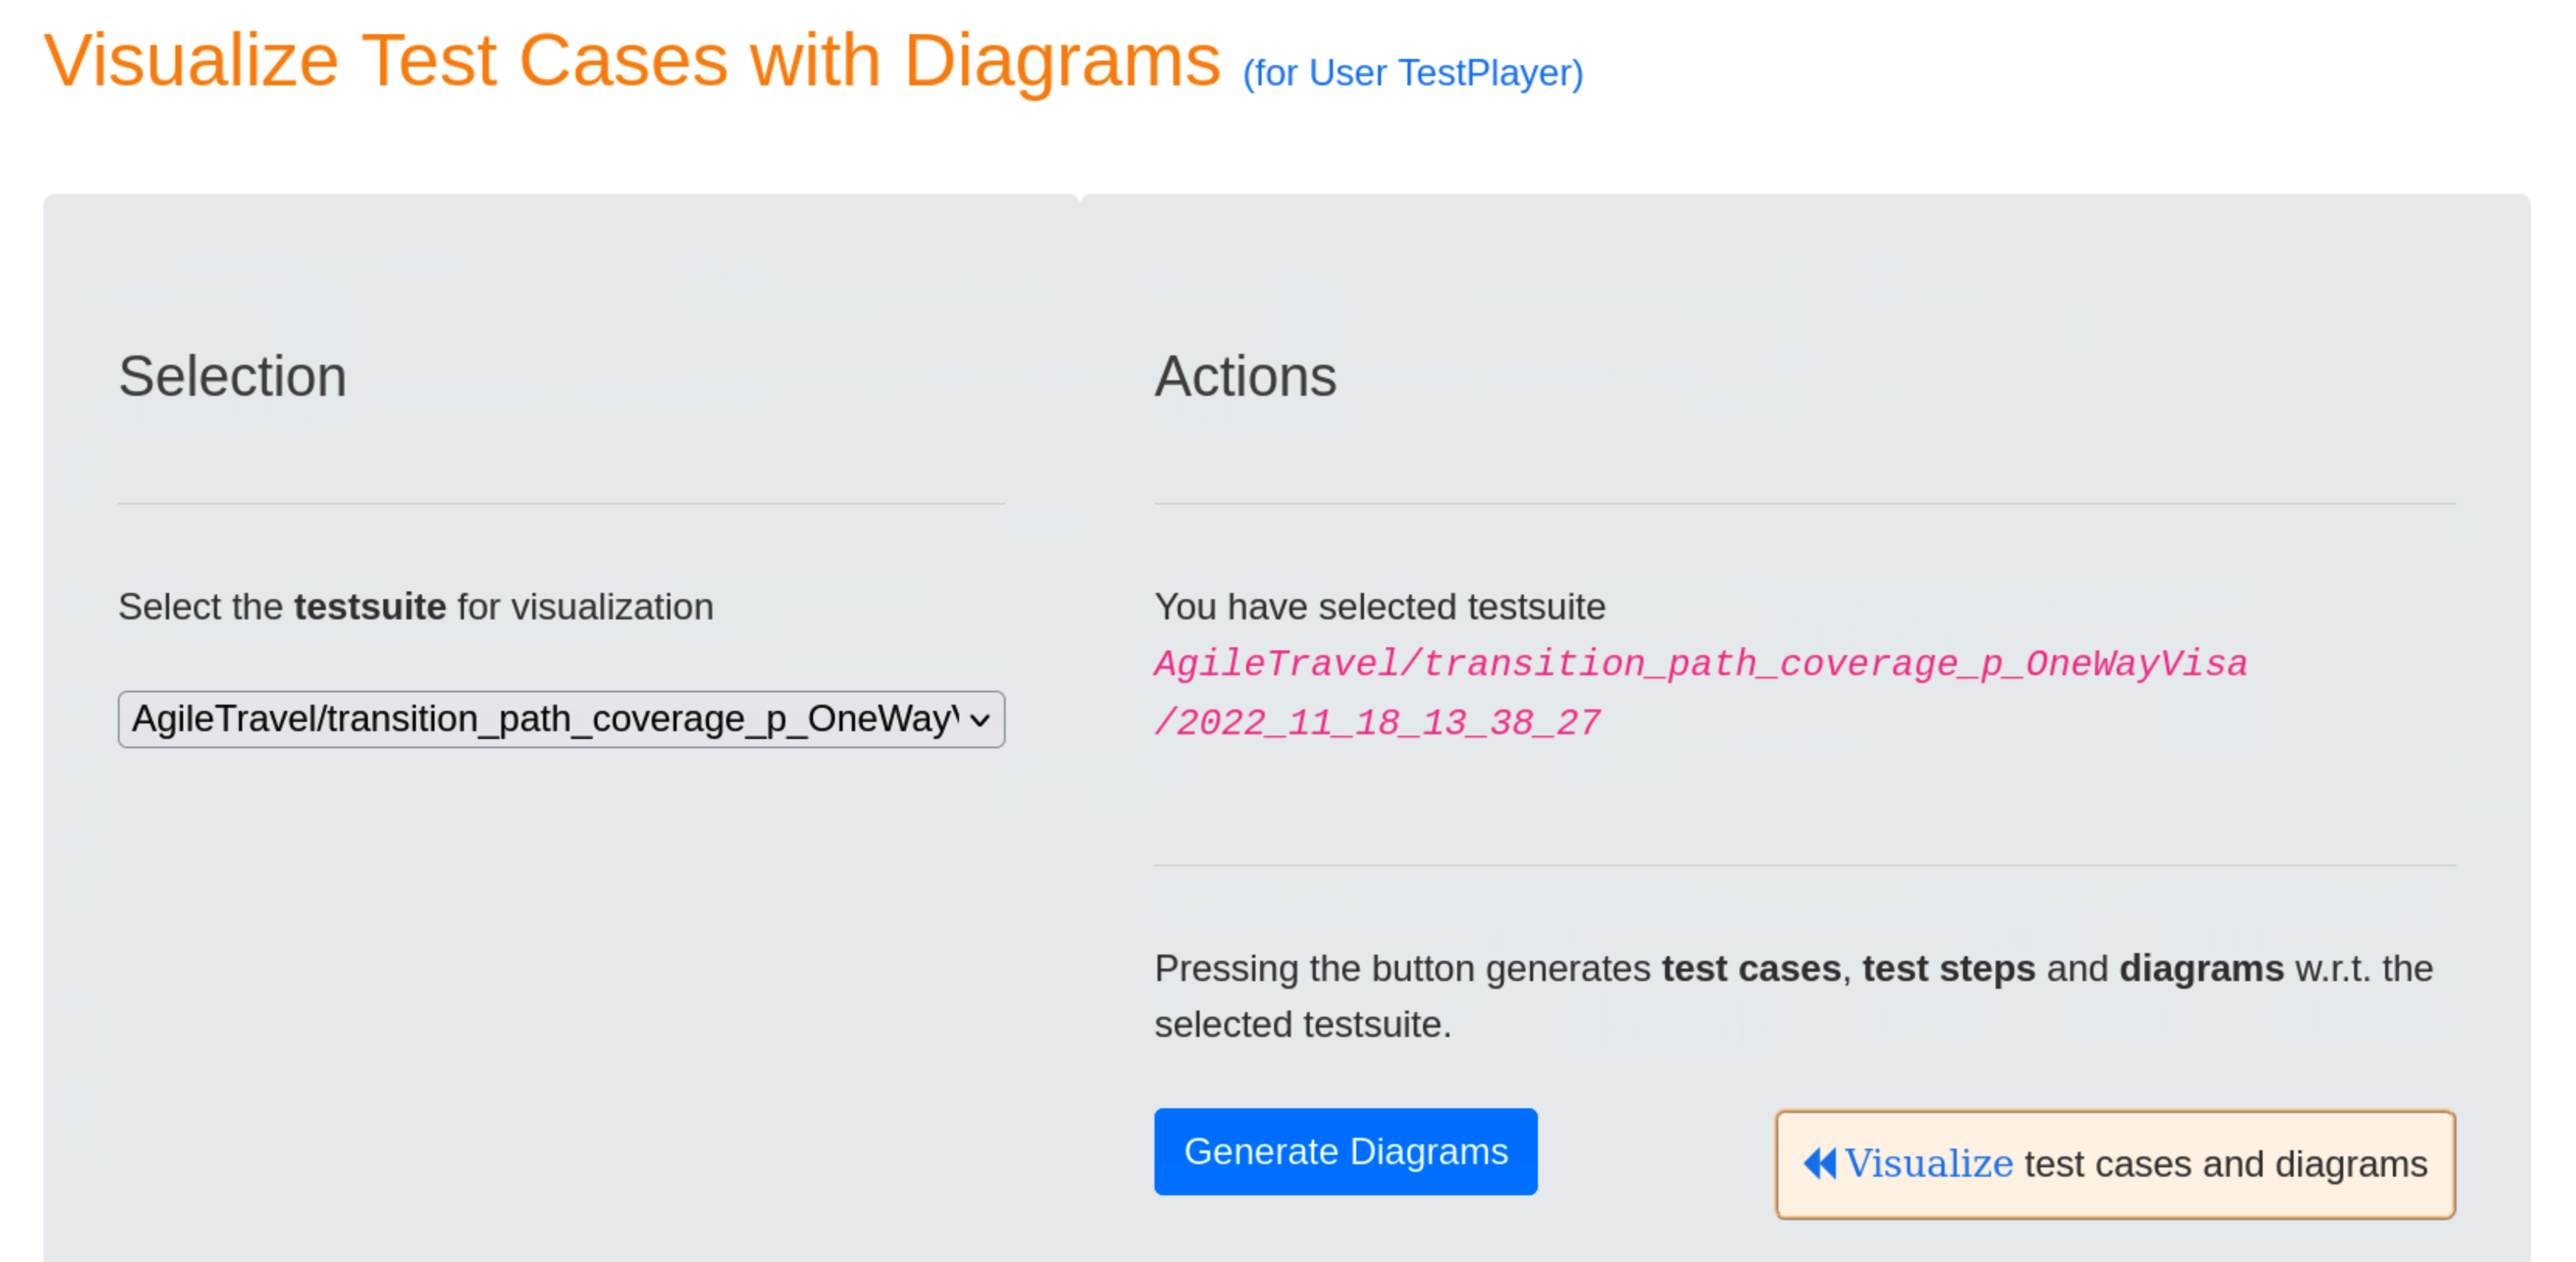
Visualization of test cases with corresponding diagrams
All test cases and test steps are visualized with corresponding diagrams when pressing the blue Generate Diagrams button and selecting the « Visualize test cases and diagrams link afterwards.
- Test Case 1
- Test Case 2
- Test Case 3
- Test Case 4
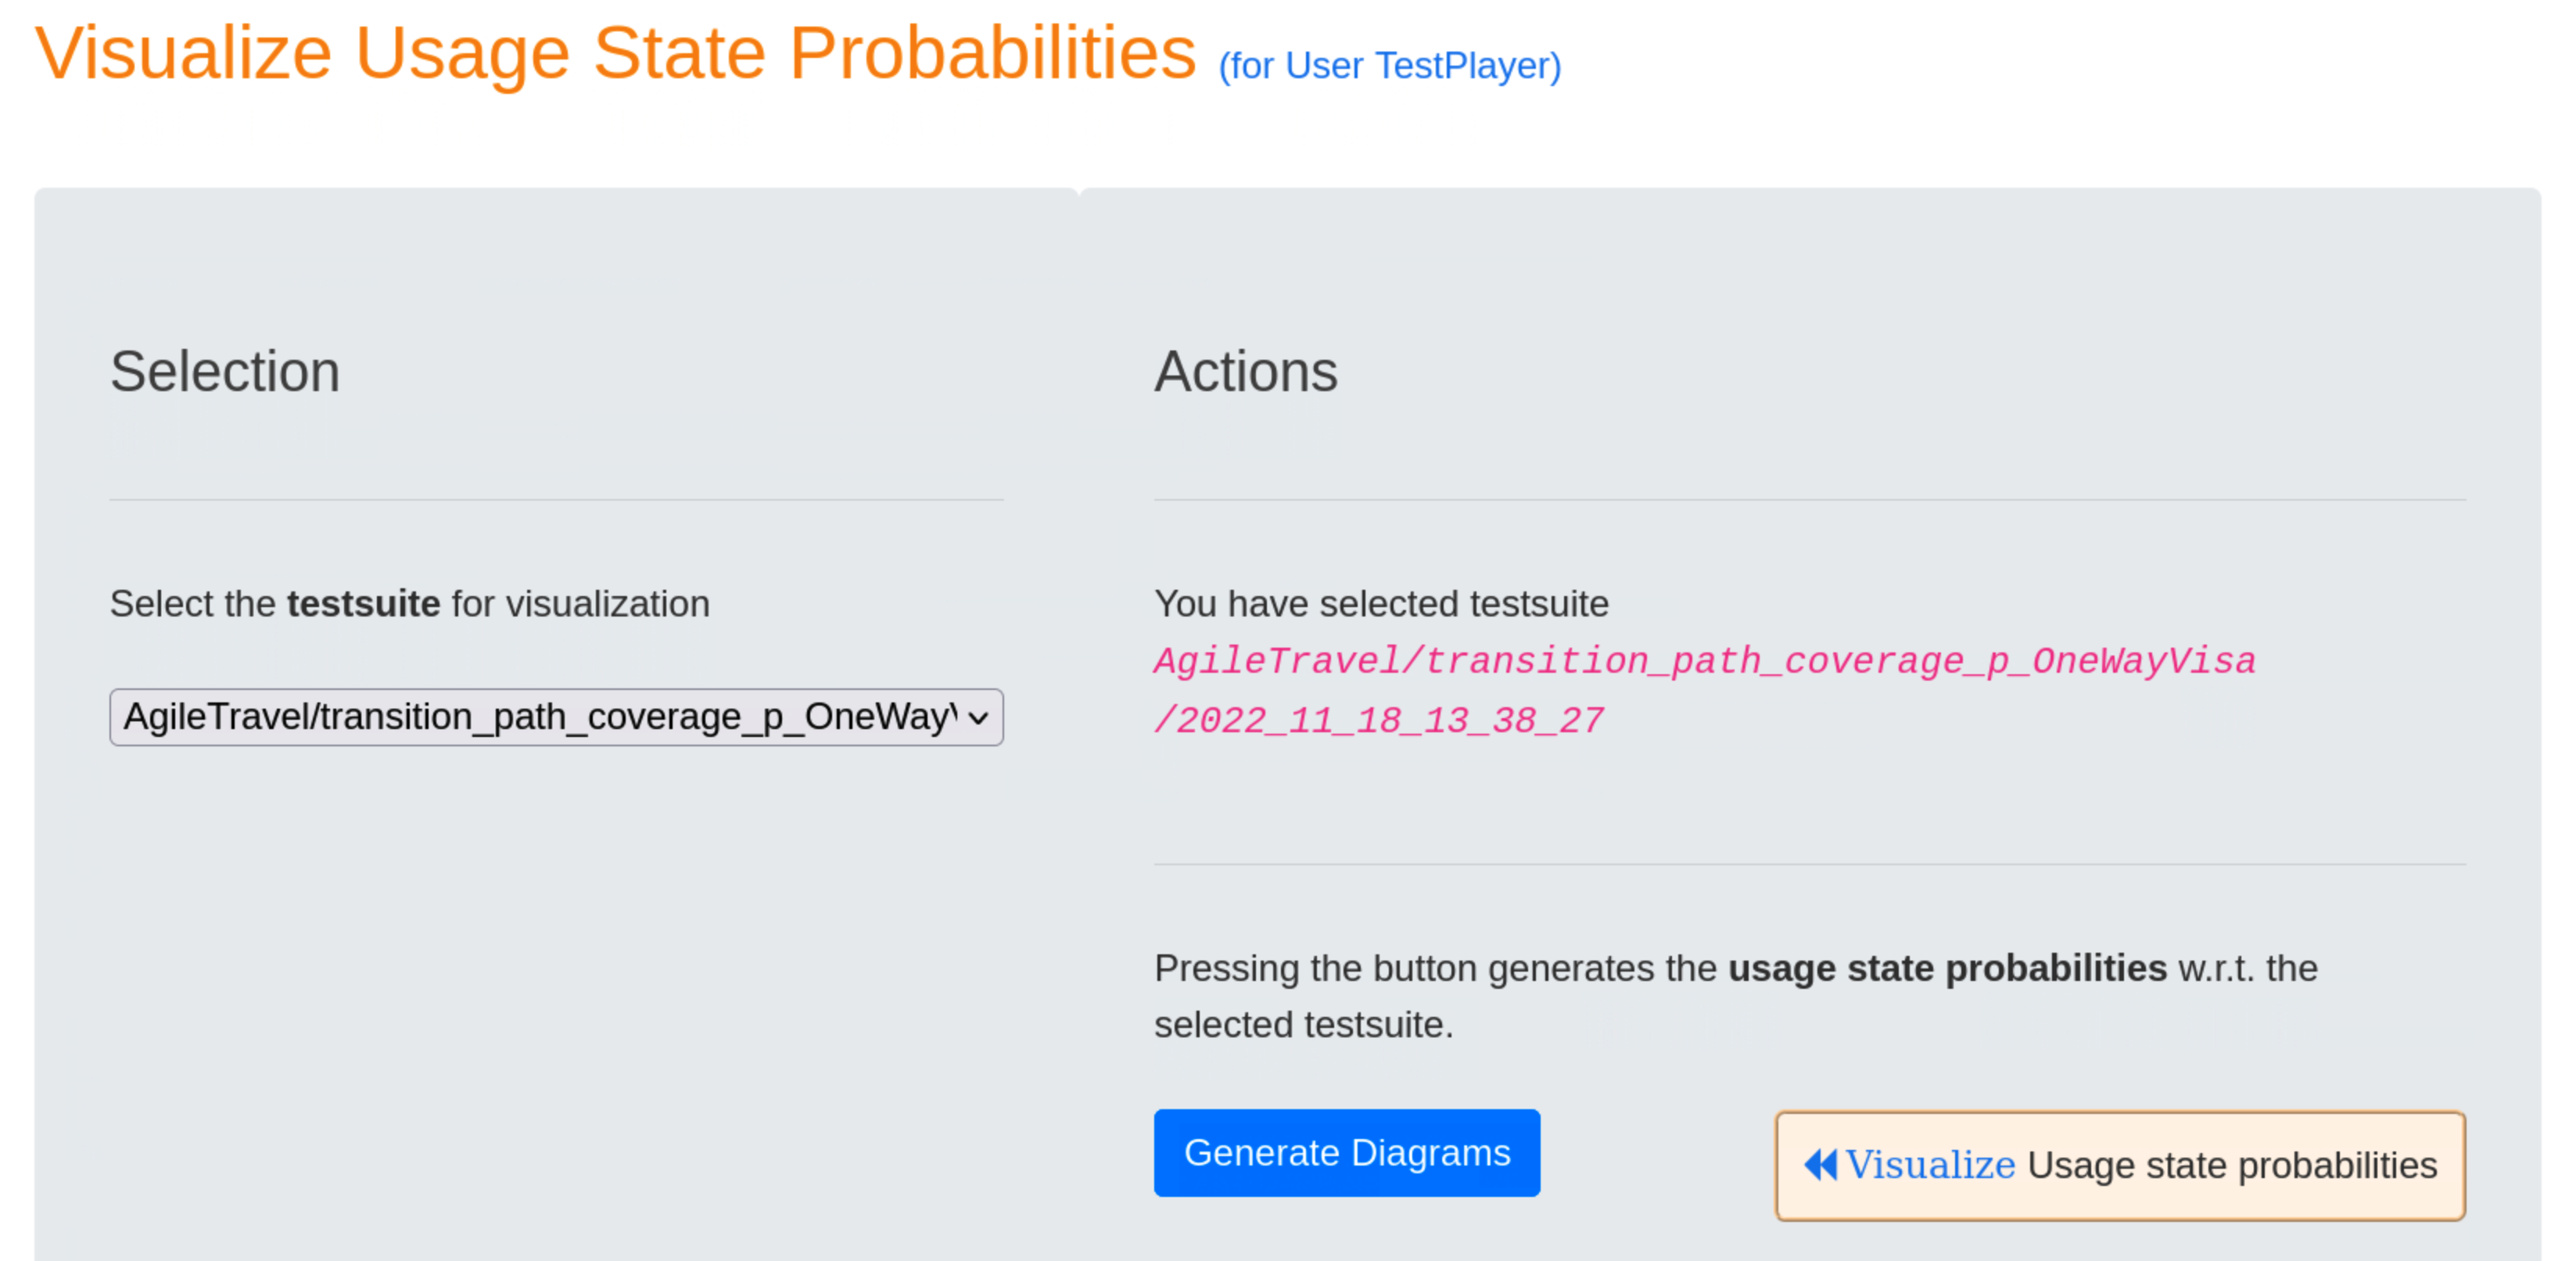
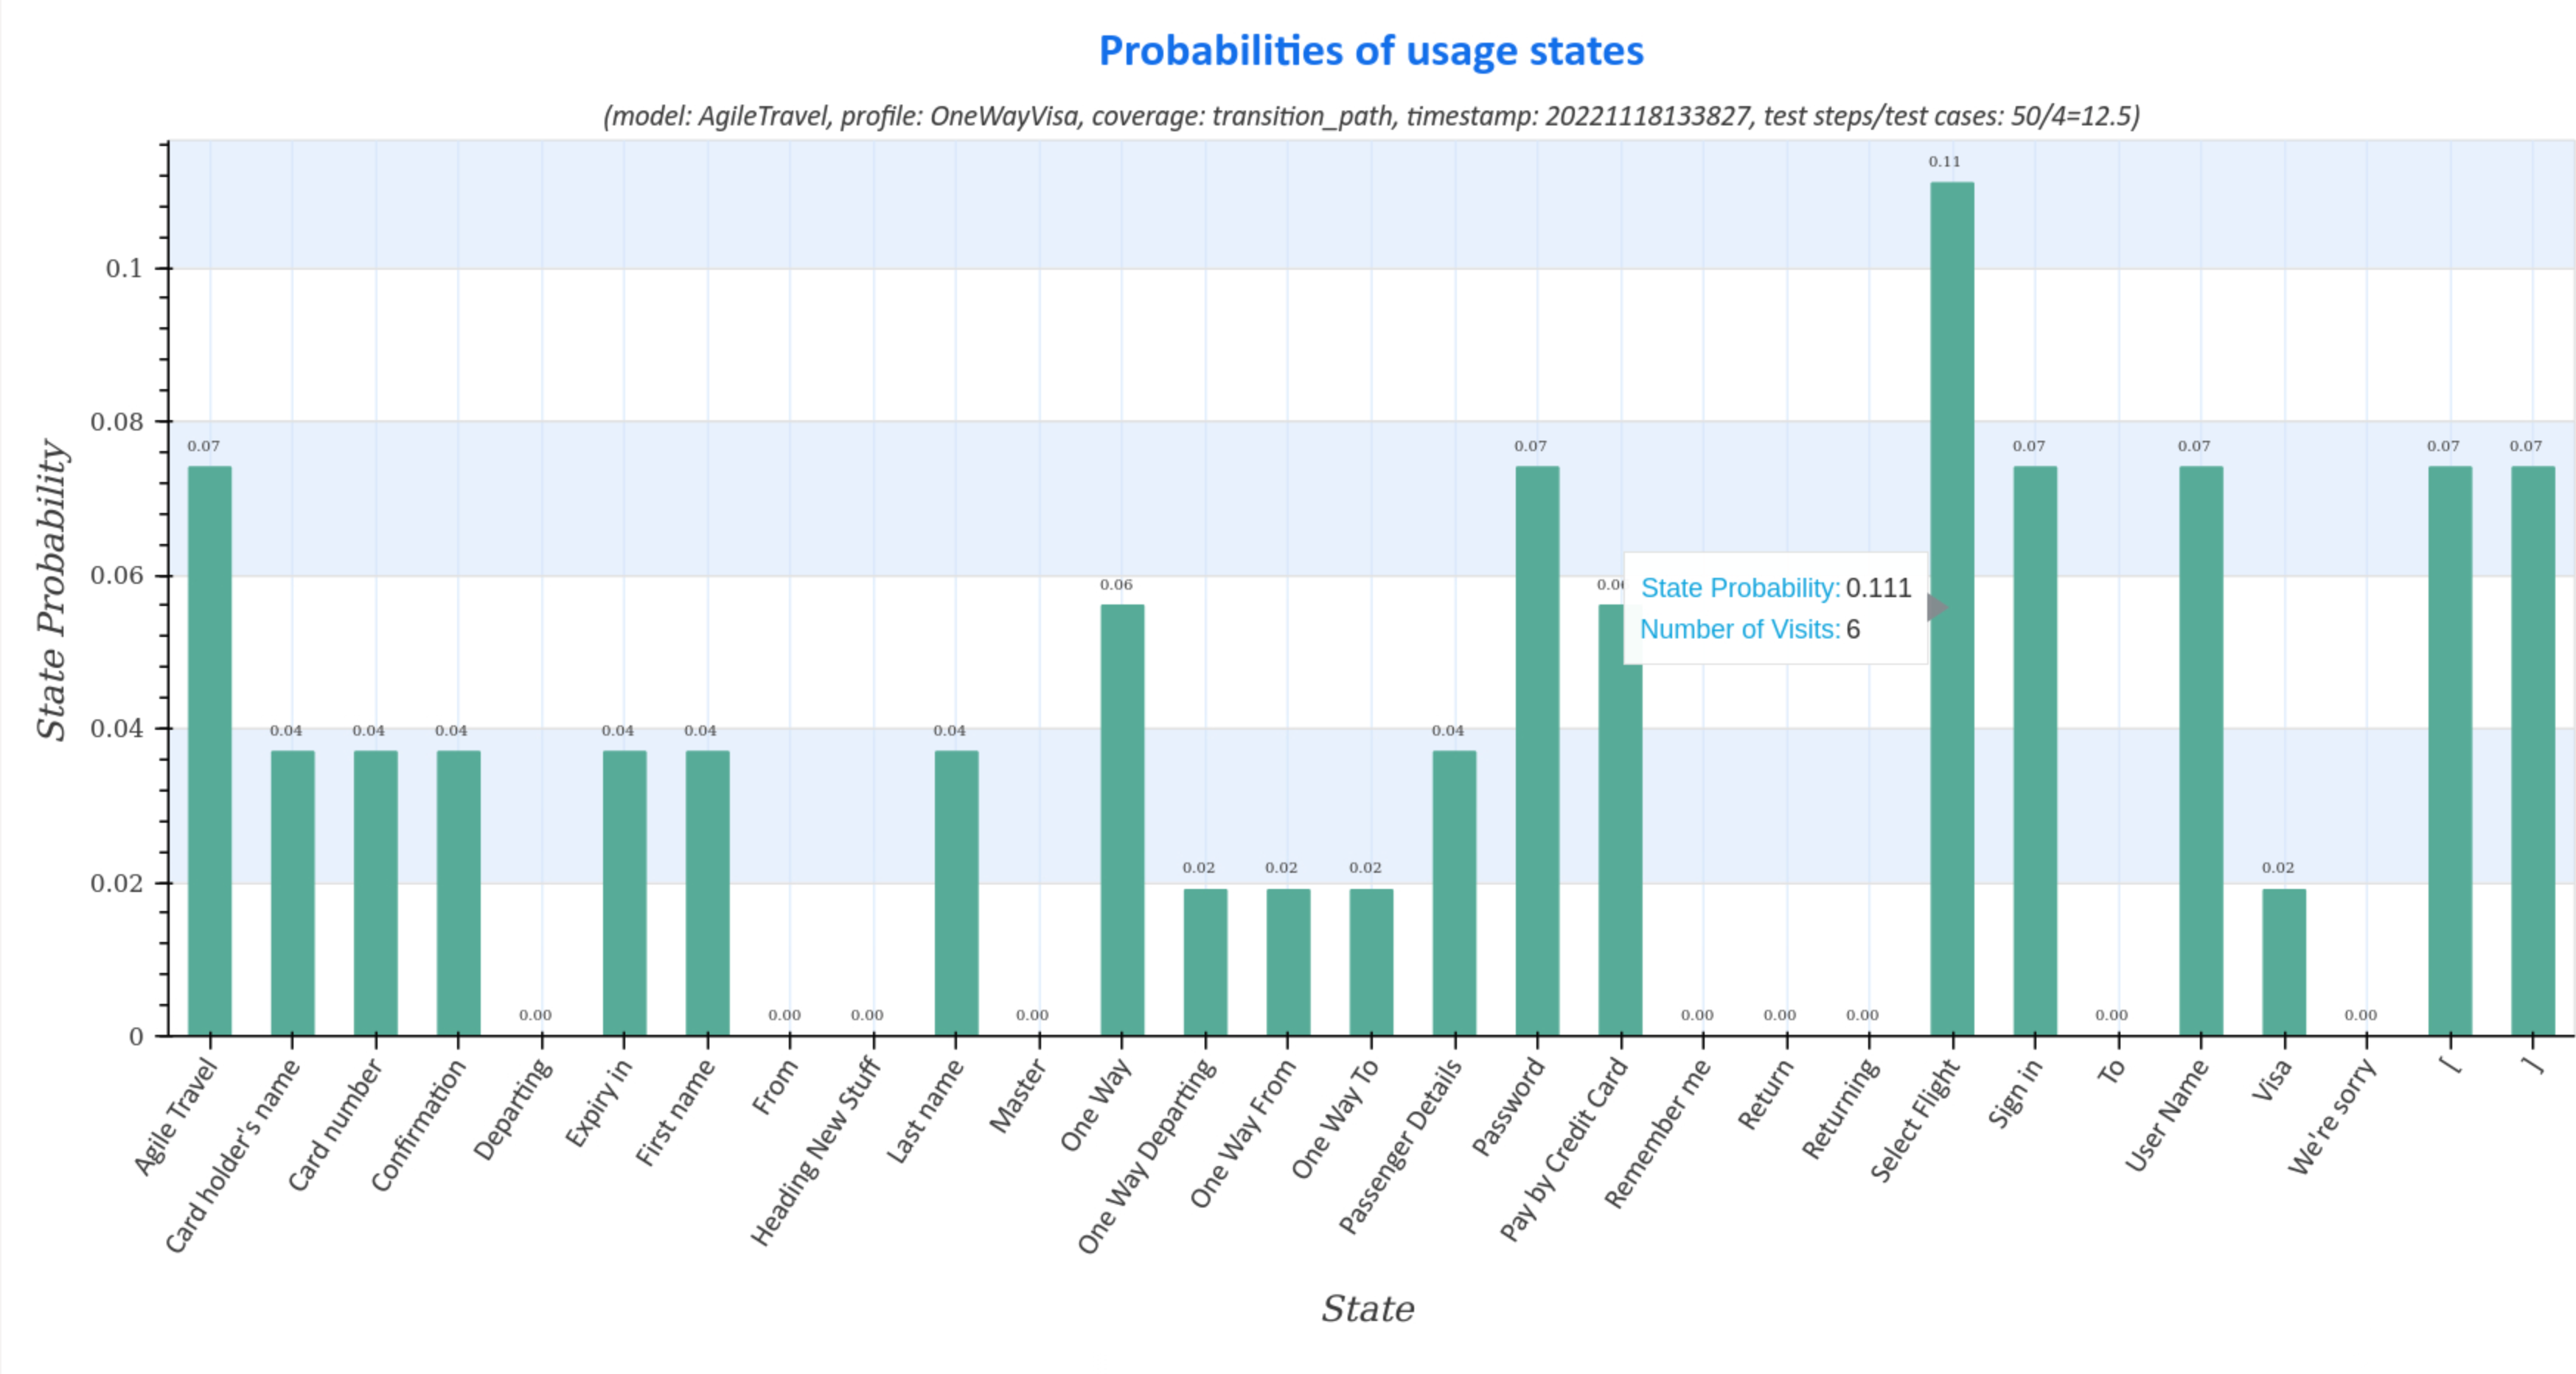
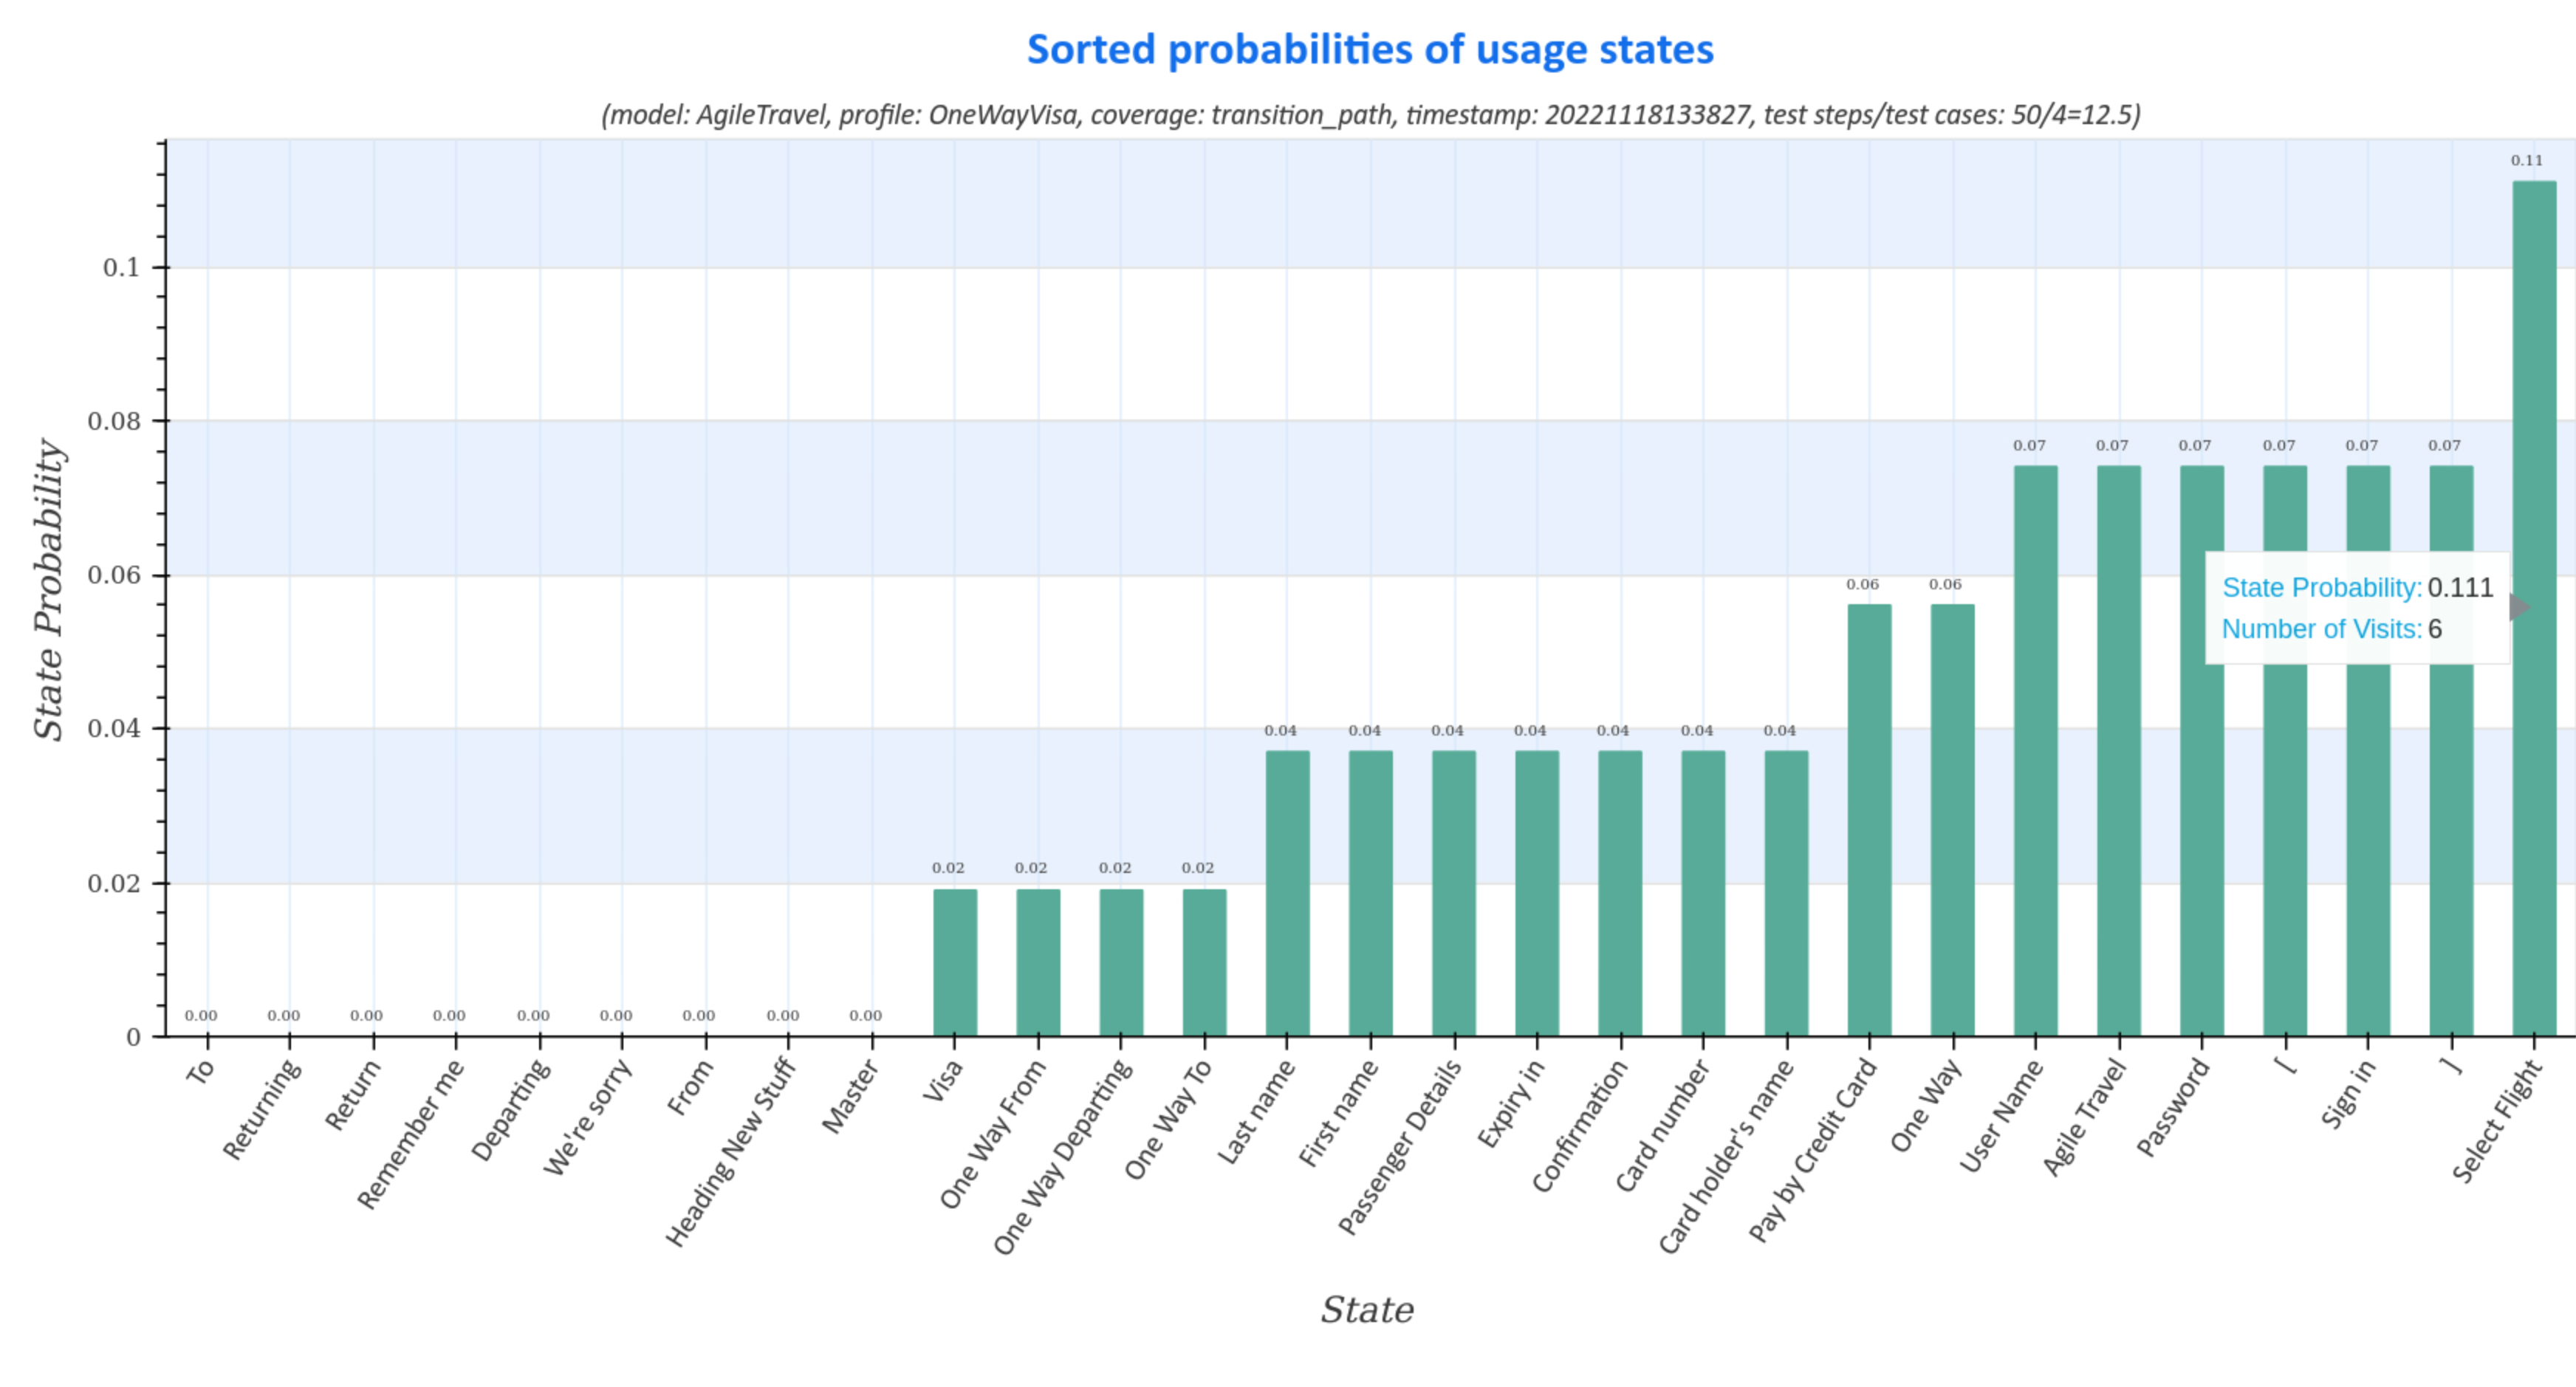
Visualization of usage state probabilities
Usage state probability diagrams of the generated test suite represent the distribution (sorted and unsorted) of usage states for all test cases.
The diagrams contain information about
- model: name of the usage model
- profile: name of the usage profile
- coverage: strategy for generating the test suite
- timestamp: time, when the test suite was generated in the form
<yyyymmddhhmmss>fory:year,m:month,d:day,h:hour,m:minuteands:second - ratio of test step to test cases:
number of test steps / number of test cases. As can be seen, the average number of test steps in the adapted test suite is12.5.
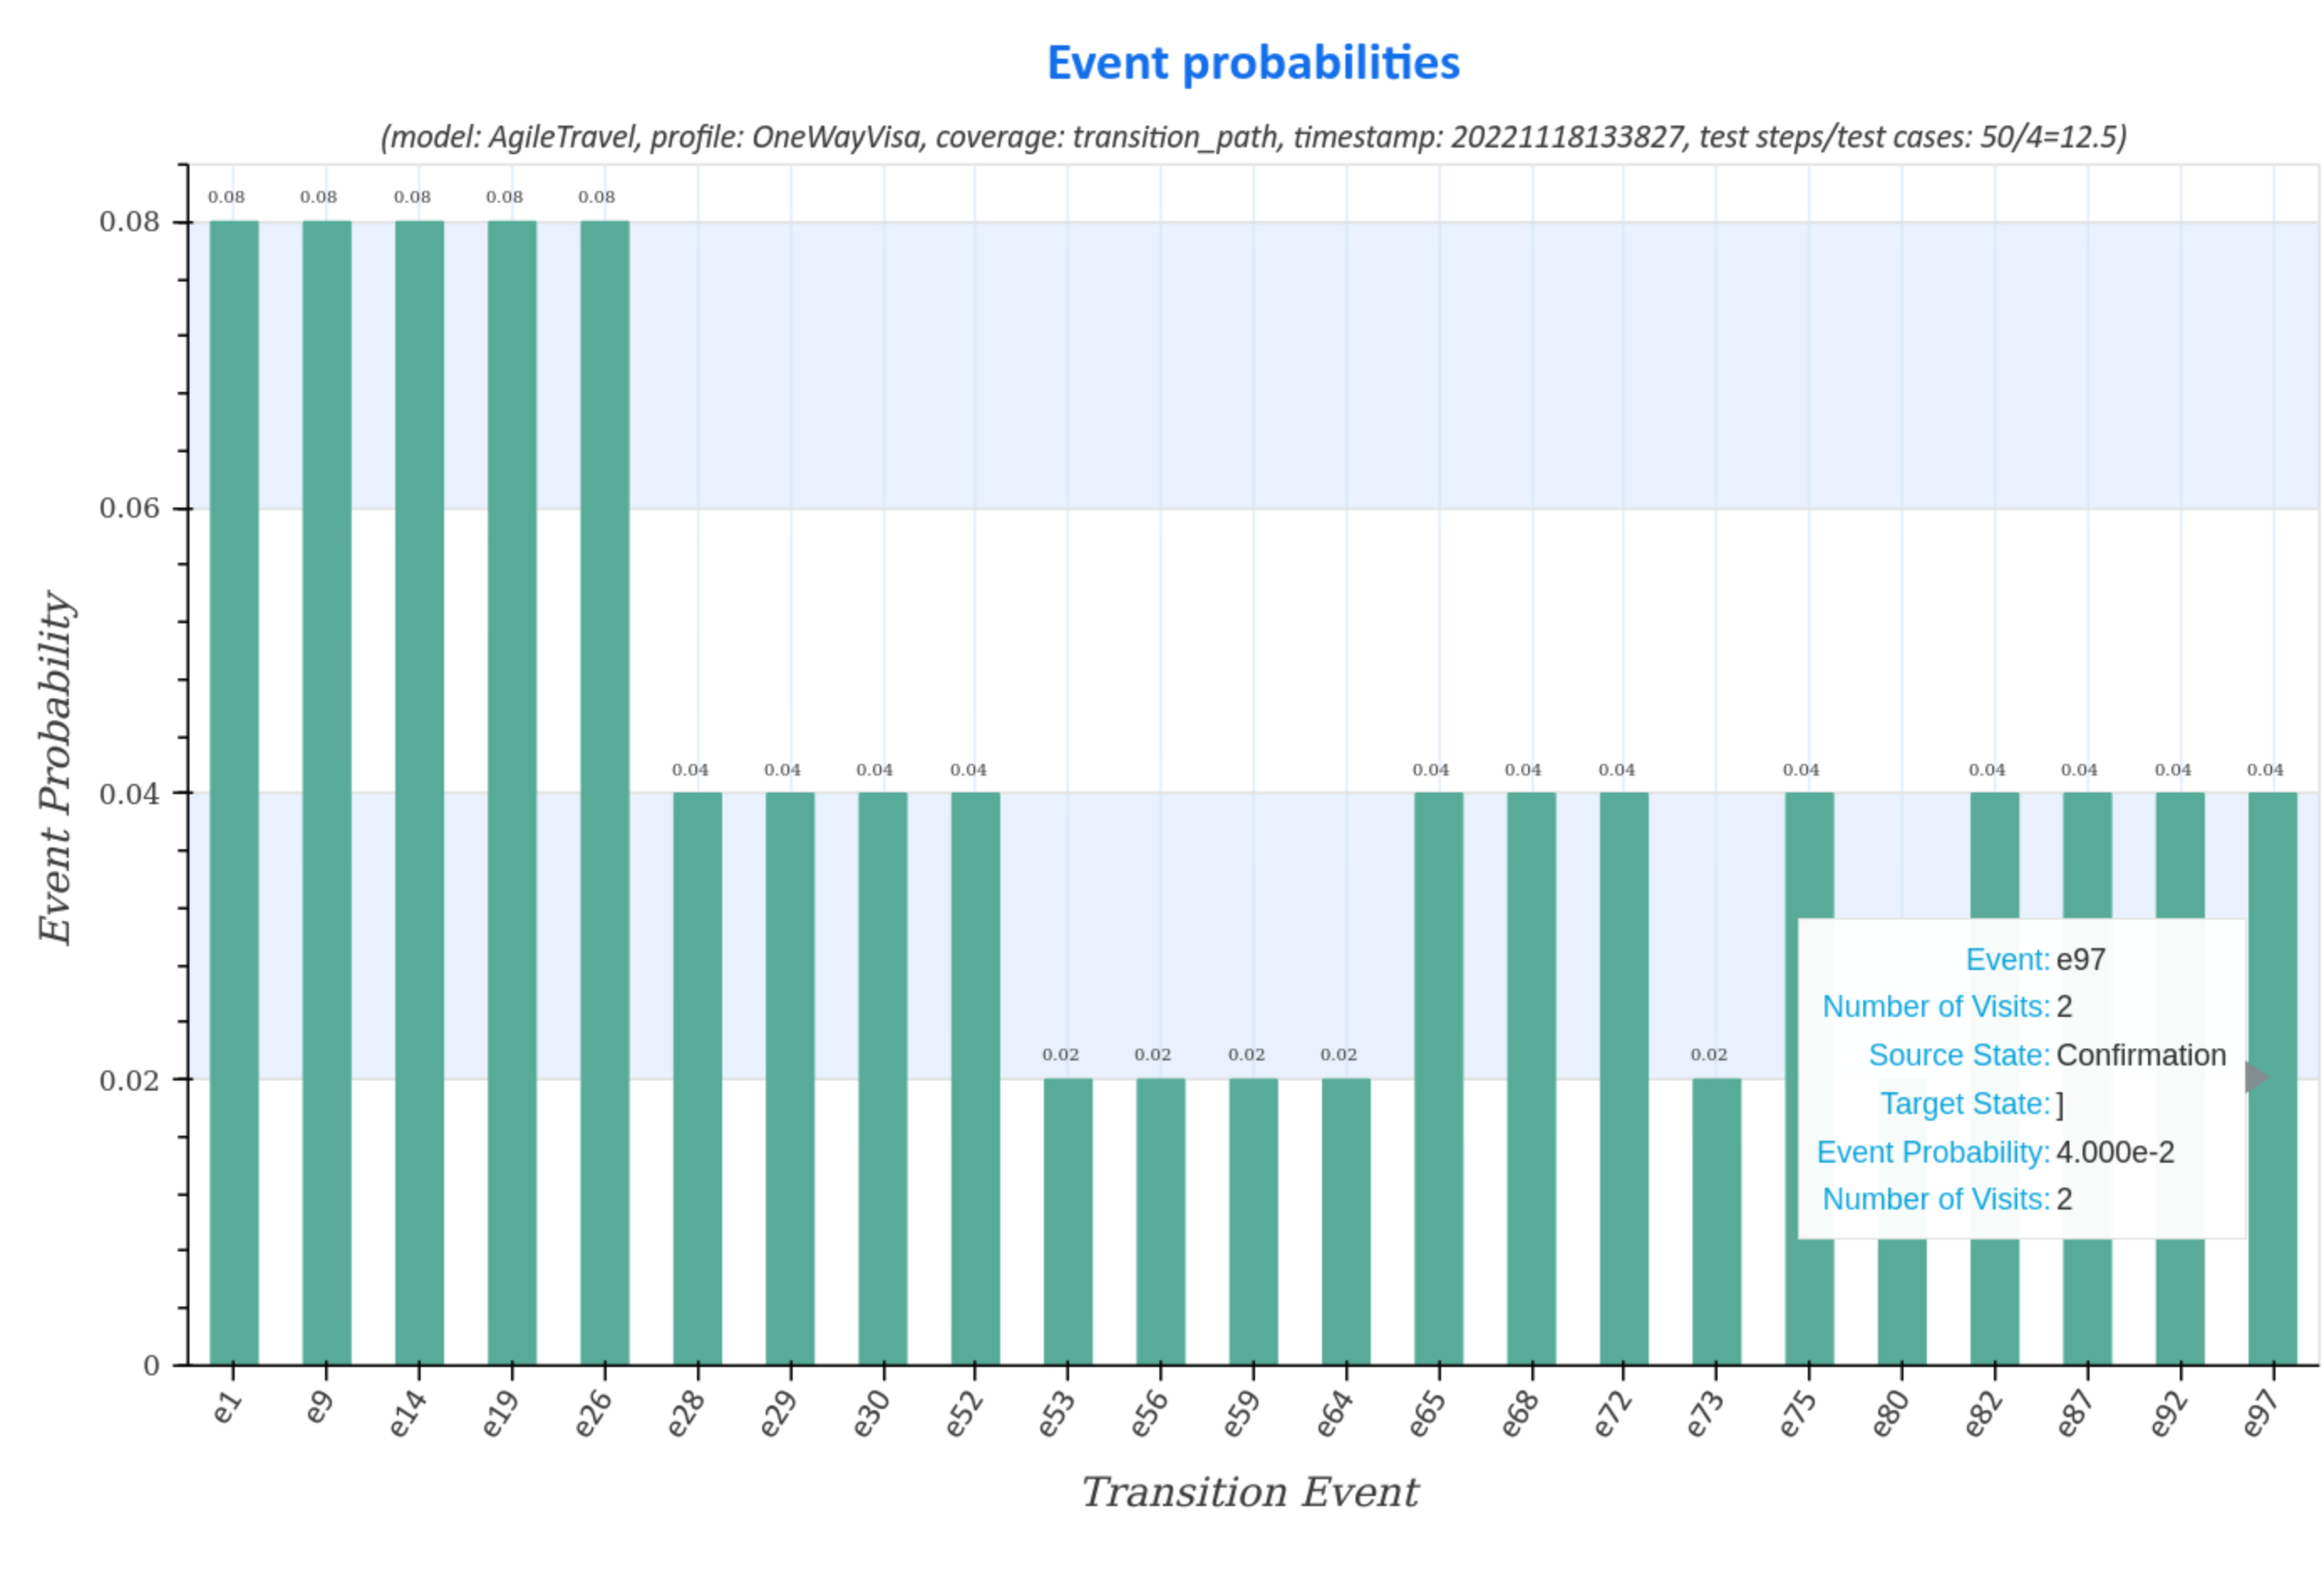
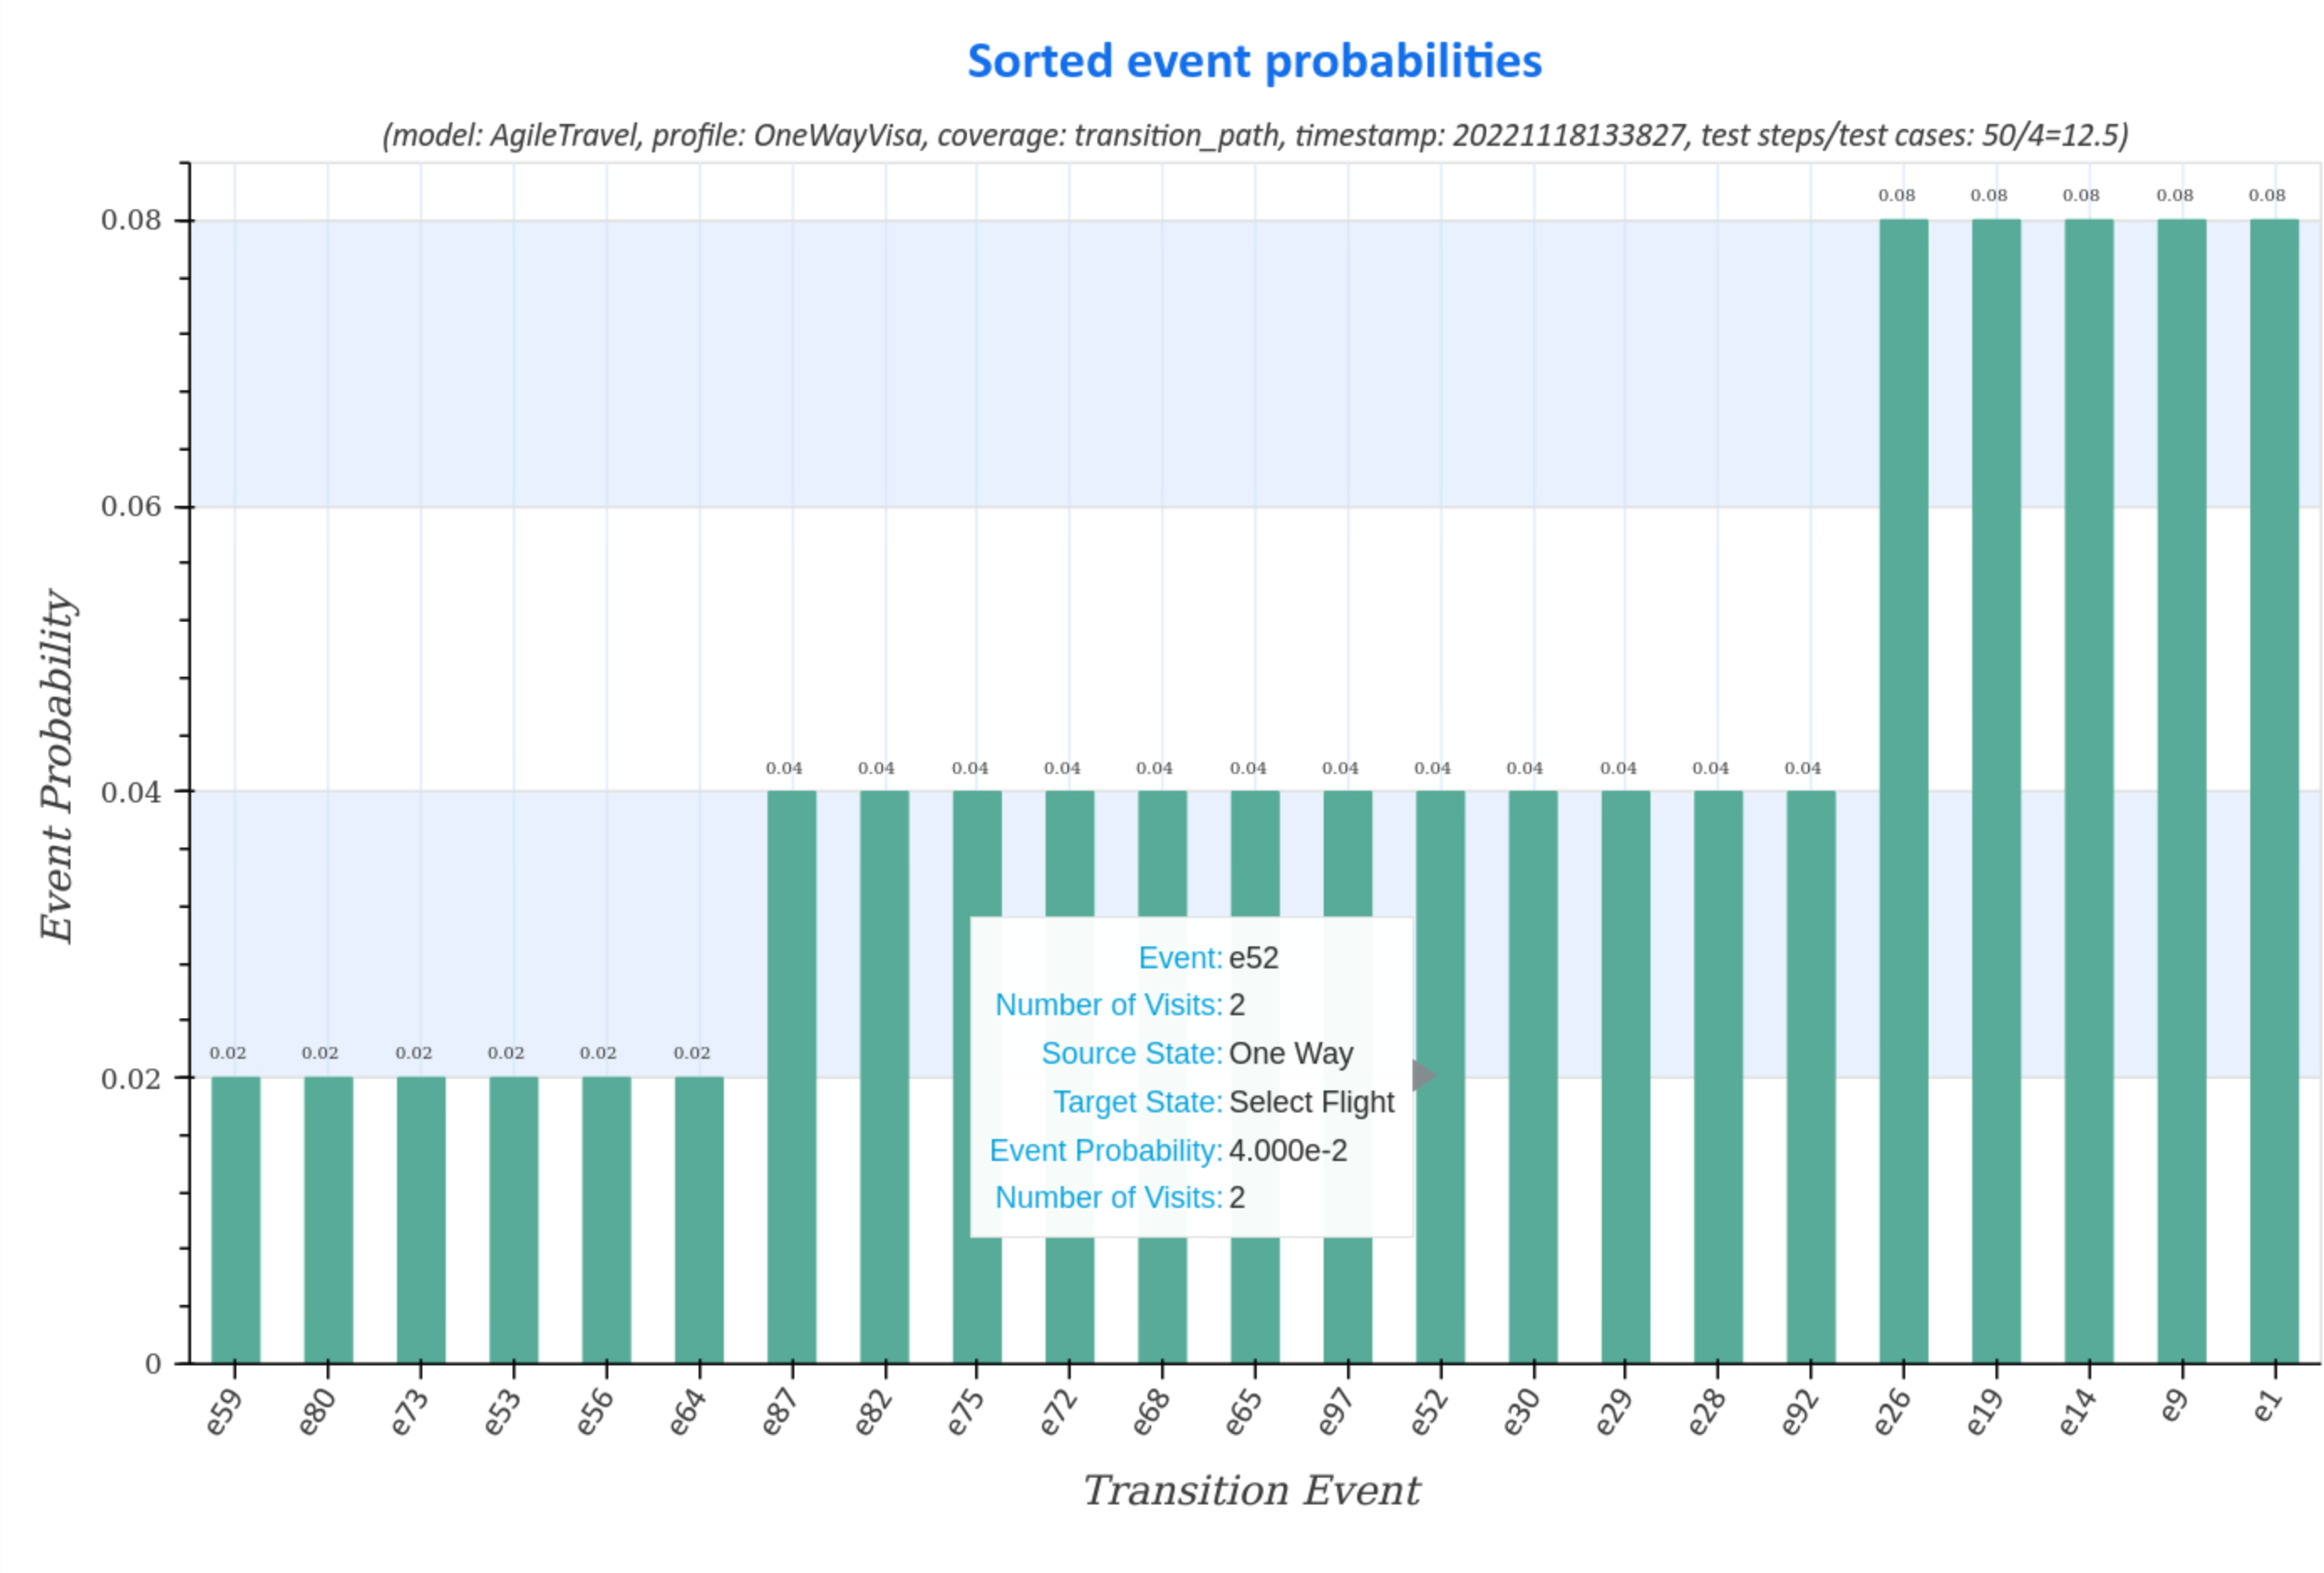
Visualization of transition event frequencies
Transition event frequency diagrams of the generated test suite represent the distribution (sorted and unsorted) of state transitions and the corresponding transition events for all test cases.
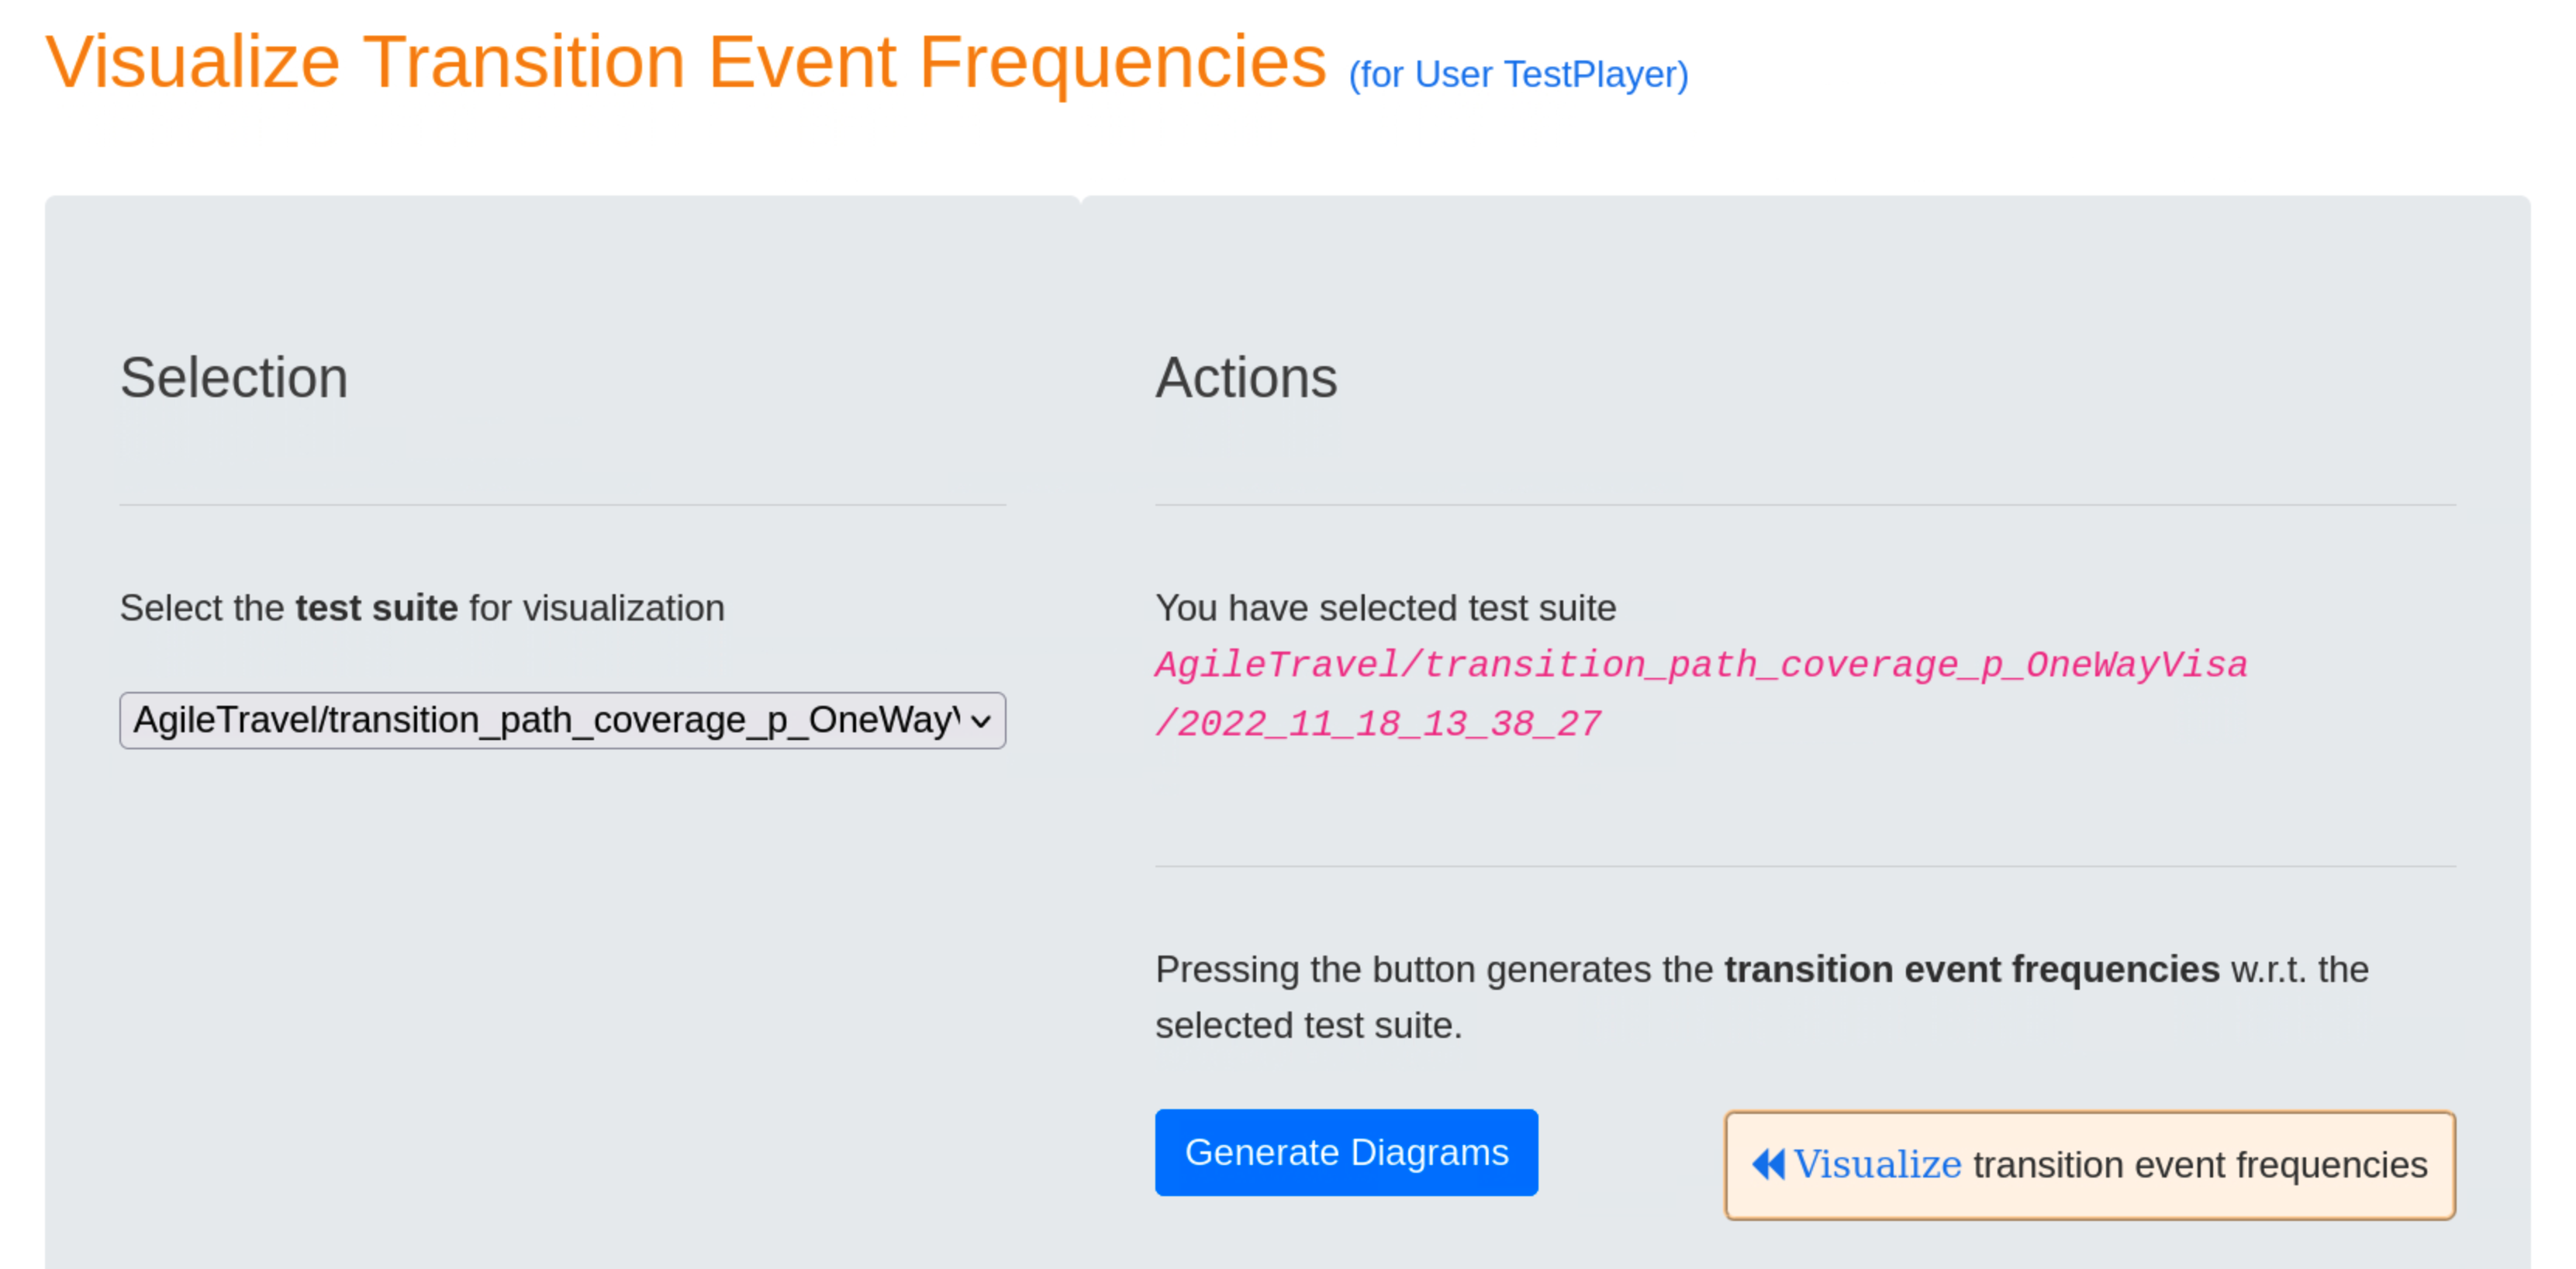
Moving the cursor over the graphs displays additional data, such as the actual number of visits during the test, the transition event and the source, respectively target usage states.
Execute, Analyze and Visualize the Test
Execute Test Run
Once the specific test suite and a suited test executable have been selected, the TestPlayer© Extension starts a robot browser (Firefox, Google, etc.) and executes the test suite automatically when the user presses the blue ⏵ button.
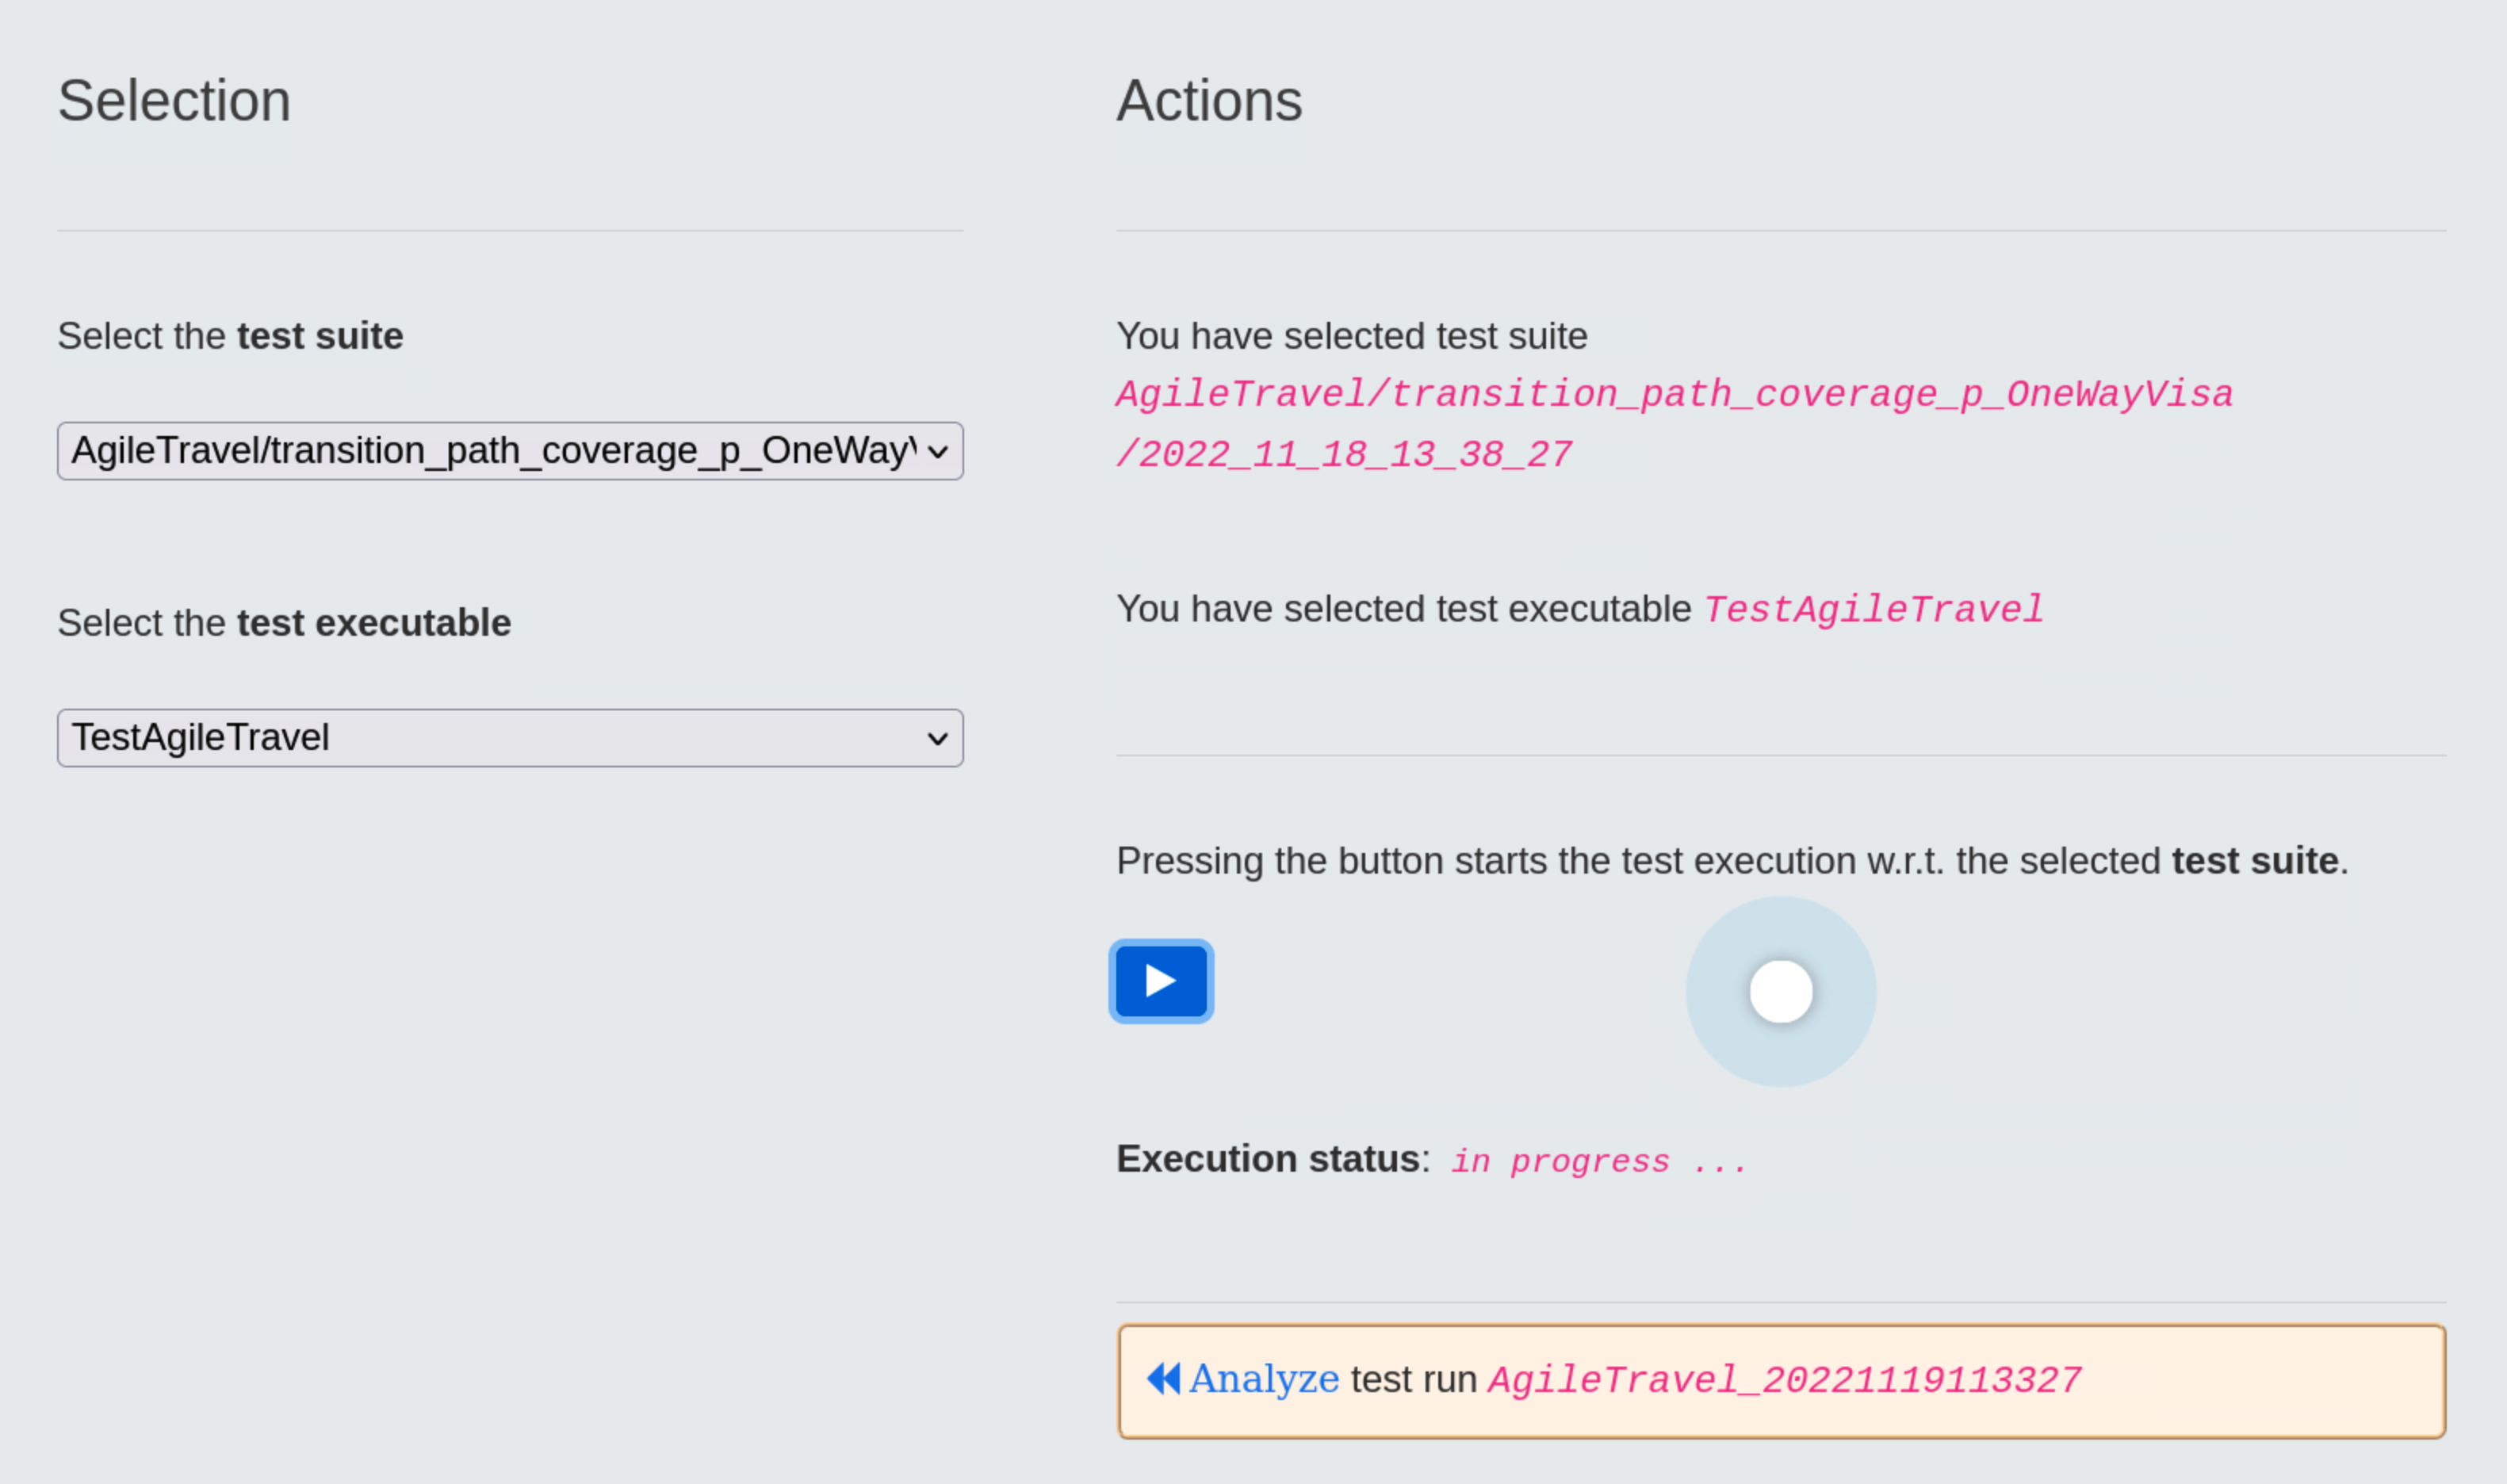
Analyze Test Run
When the test run is completed, it receives a timestamp, in our case 20221119113327, which the test engineer must use to start the test run analysis.
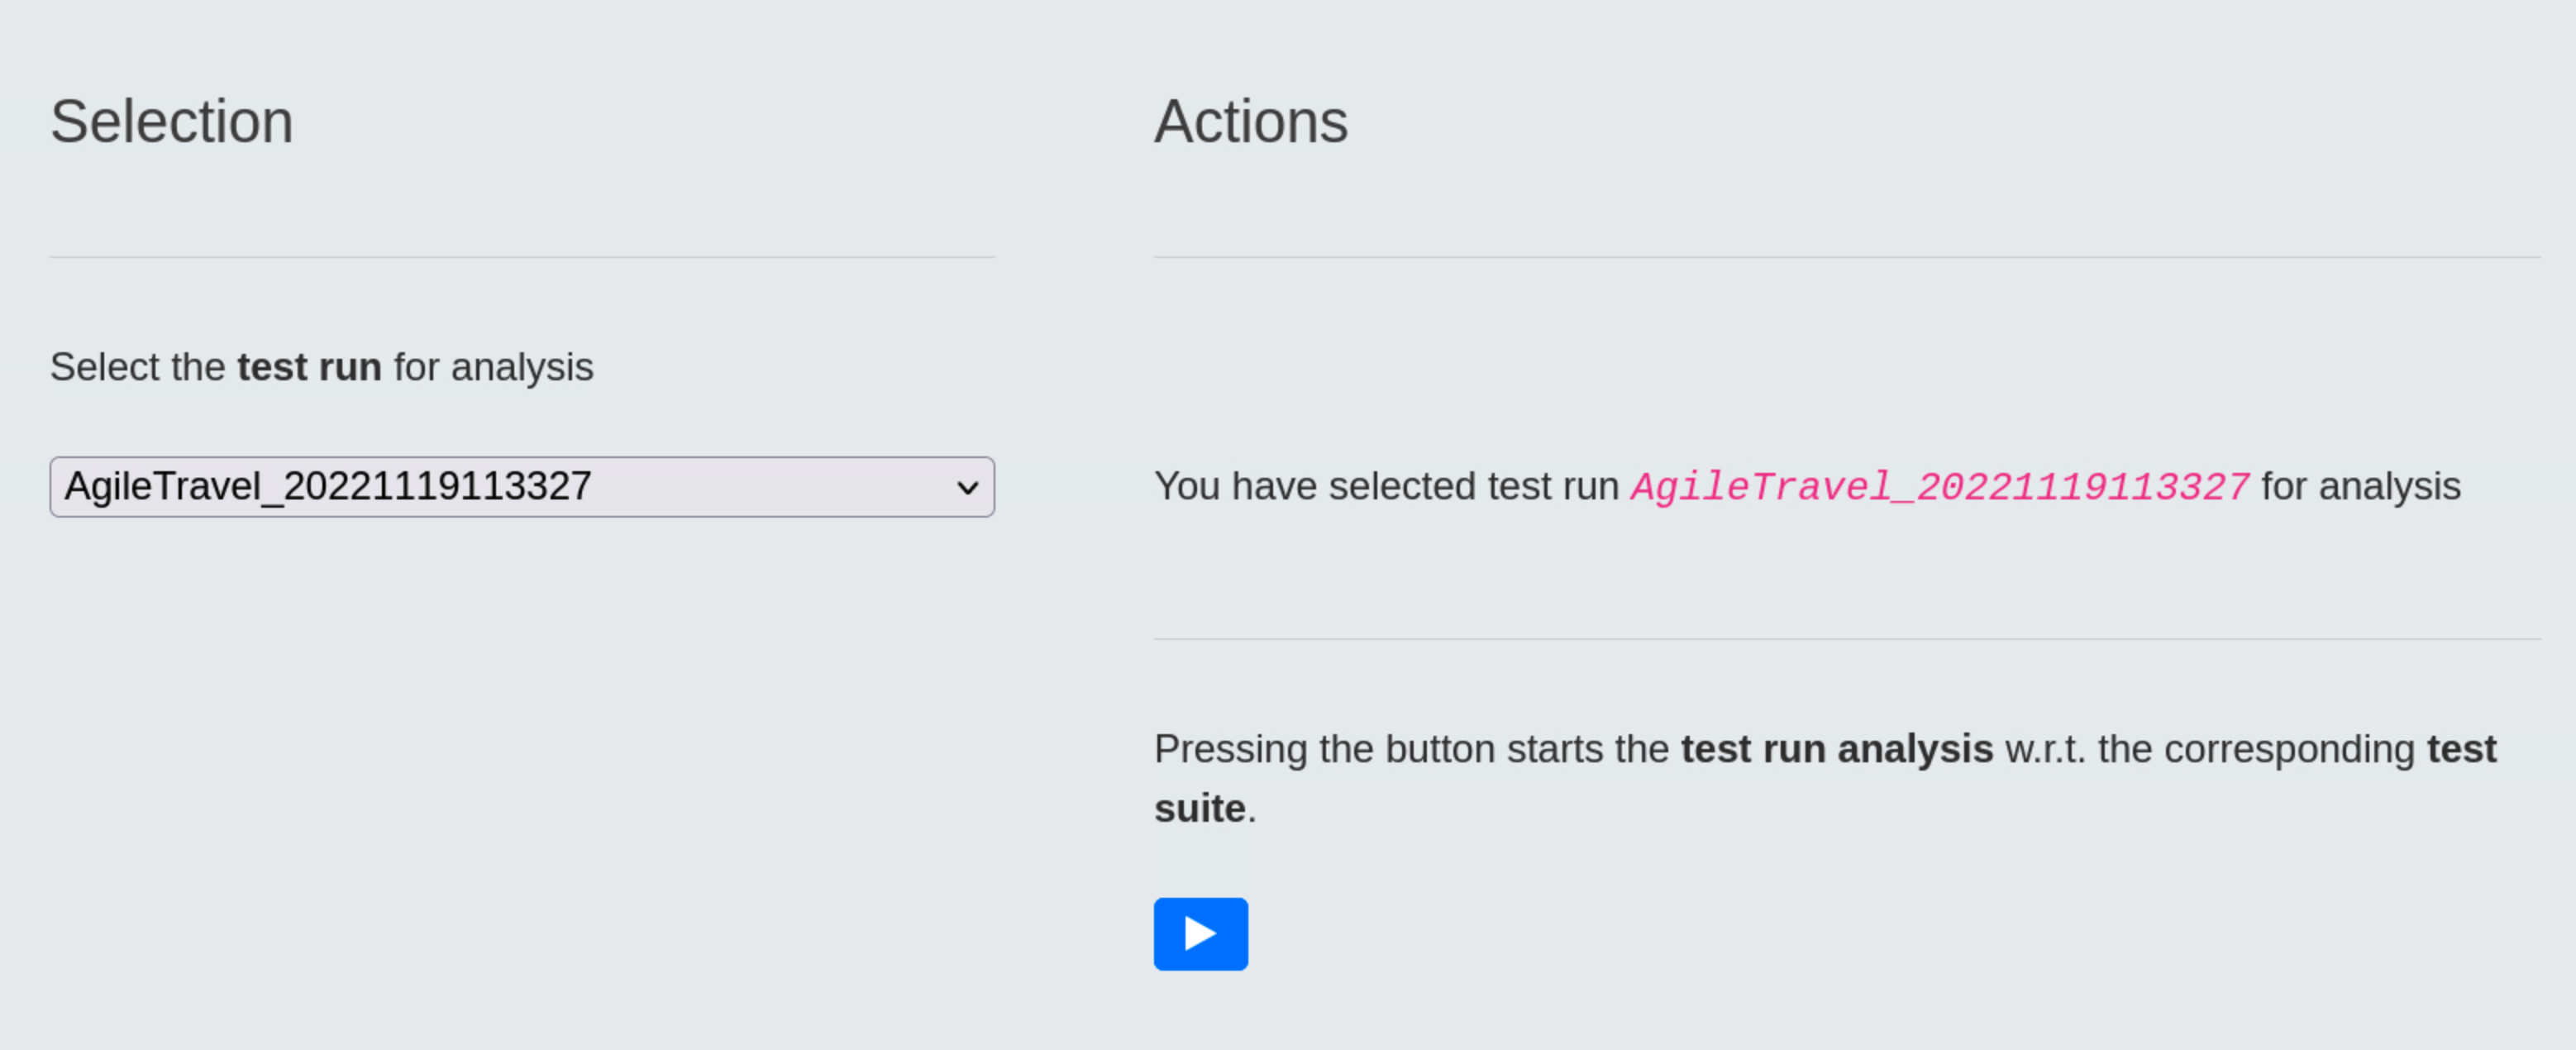
Pressing the blue ⏵ button starts the test run analysis in relation to the corresponding test suite. The result is a series of diagrams used to visualize various aspects of selected test run.
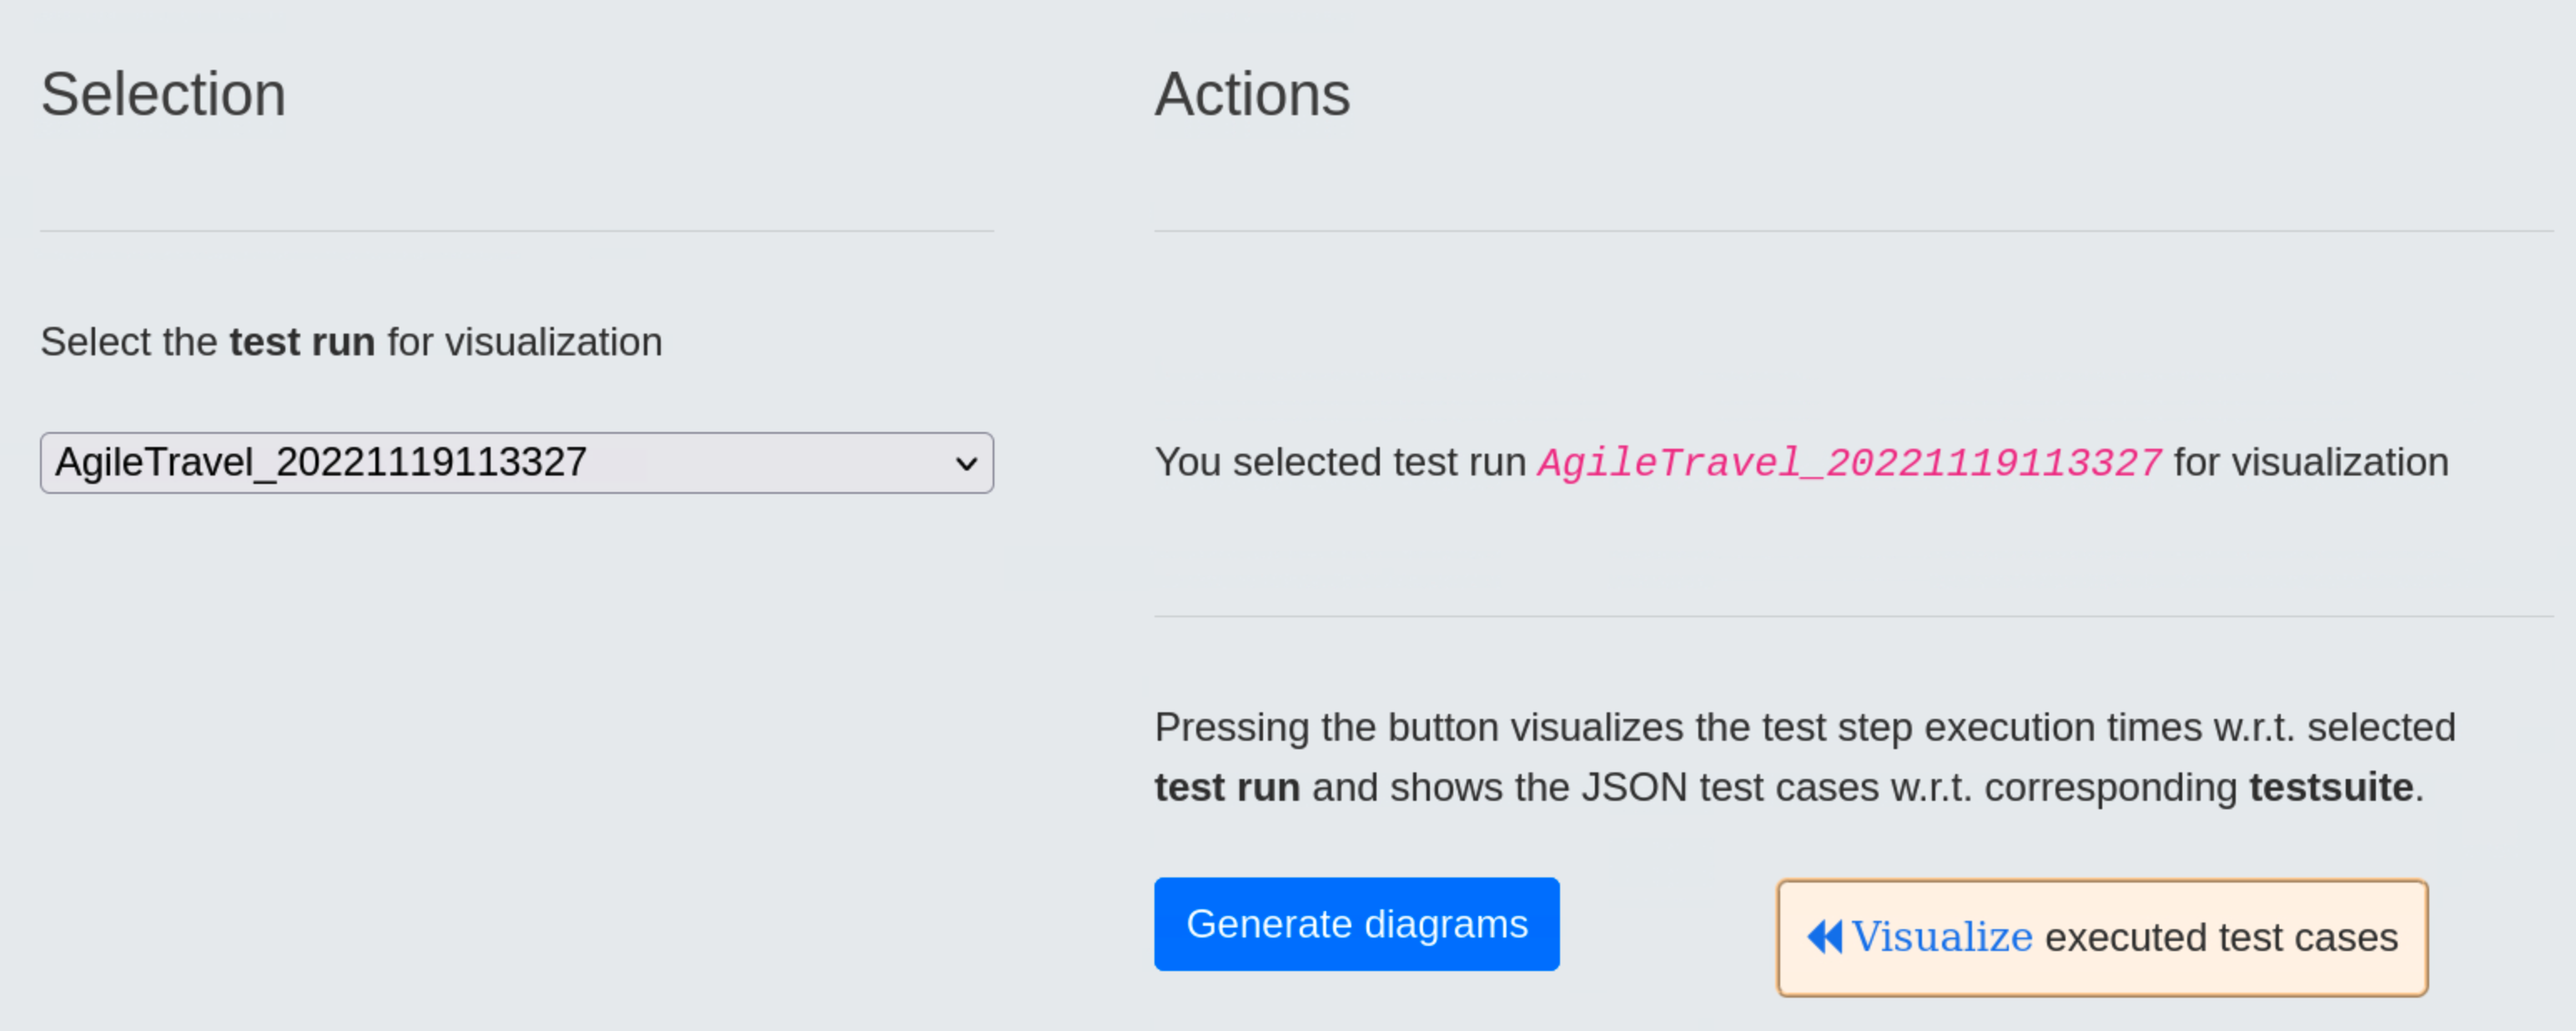
Visualize Test Run
Upon completion of the test run analysis, the TestPlayer© Extension provides various diagrams and test reports. The tester is able to evaluate characteristic properties and the quality of the SUT by evaluating
- test step execution times of individual test cases in relation to the selected test run and the associated test suite
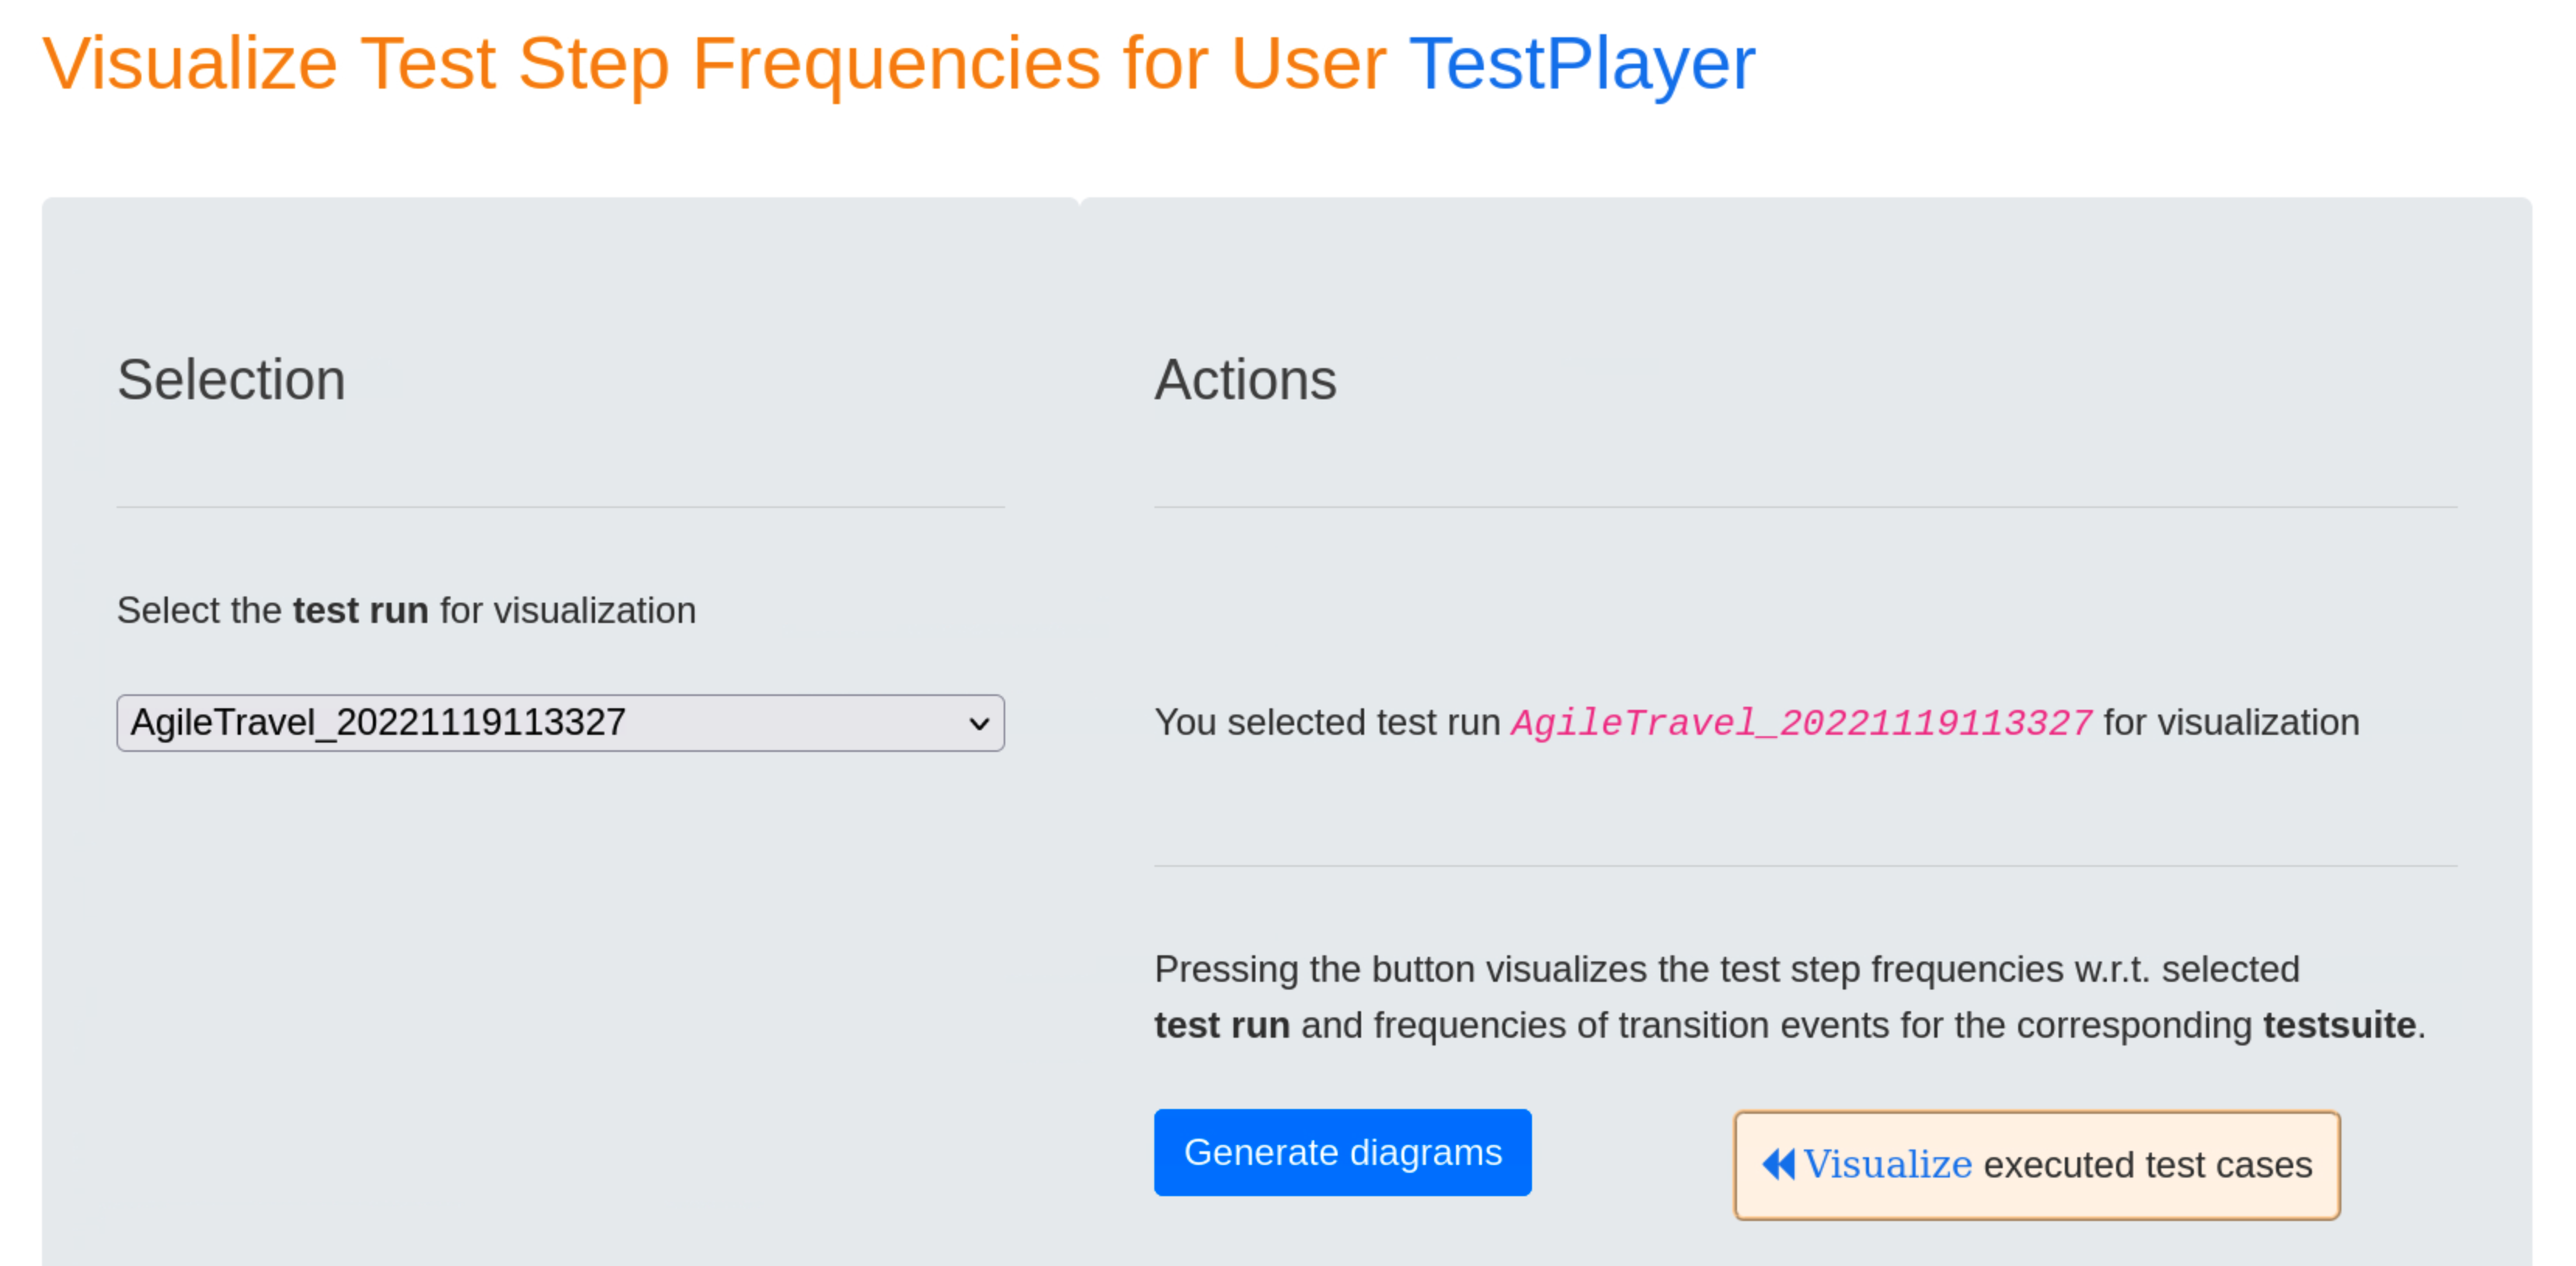
- frequencies of test steps with respect to the selected test run and frequencies of transition events for the corresponding test suite
- various metrics of test step execution times with respect to the selected test run, e.g. minimum, average and maximum values of execution times.
Visualize test step execution times
Test step execution times of individual test cases in relation to the selected test run and the associated test suite are visualized after pressing the blue Generate diagrams button and the Visualize executed test cases link.
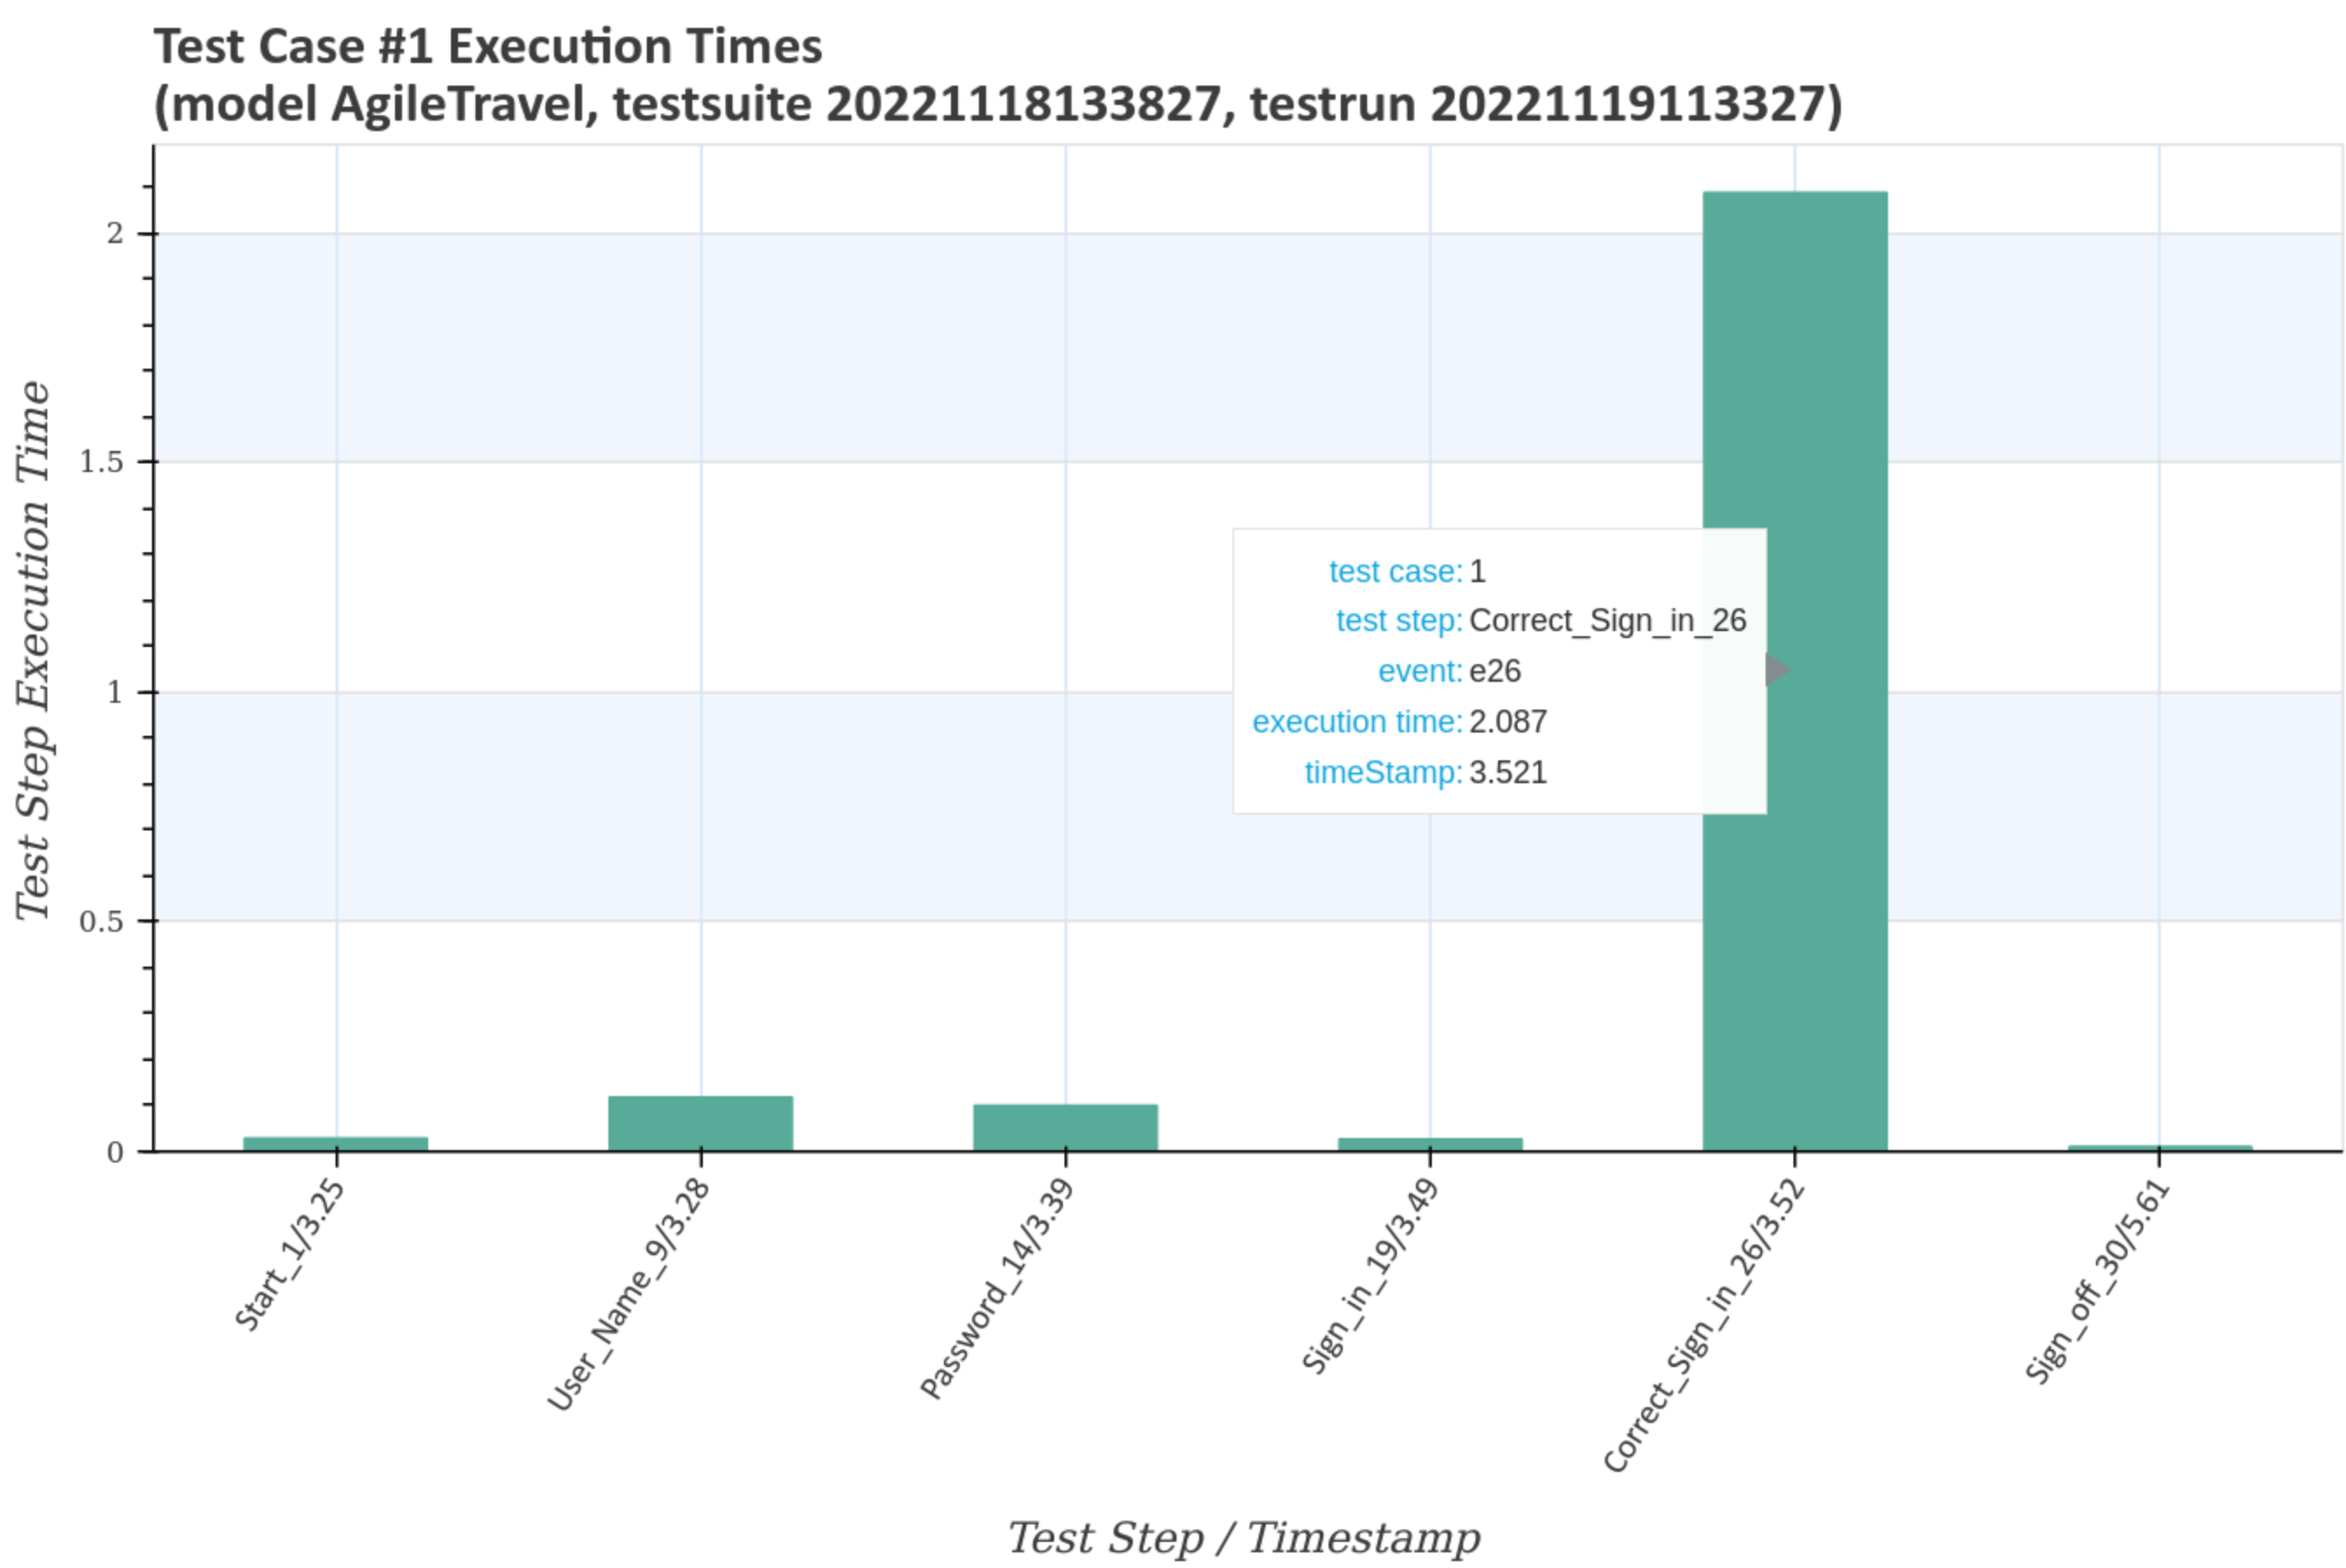
The first diagramm gives an overview of the execution times of the test steps for the test run with the unique timestamp 20221119113327 and the adapted test suite with the unique timestamp 20221118133827. Double-clicking on the image shows an enlarged image with more details when you move the mouse pointer over it.
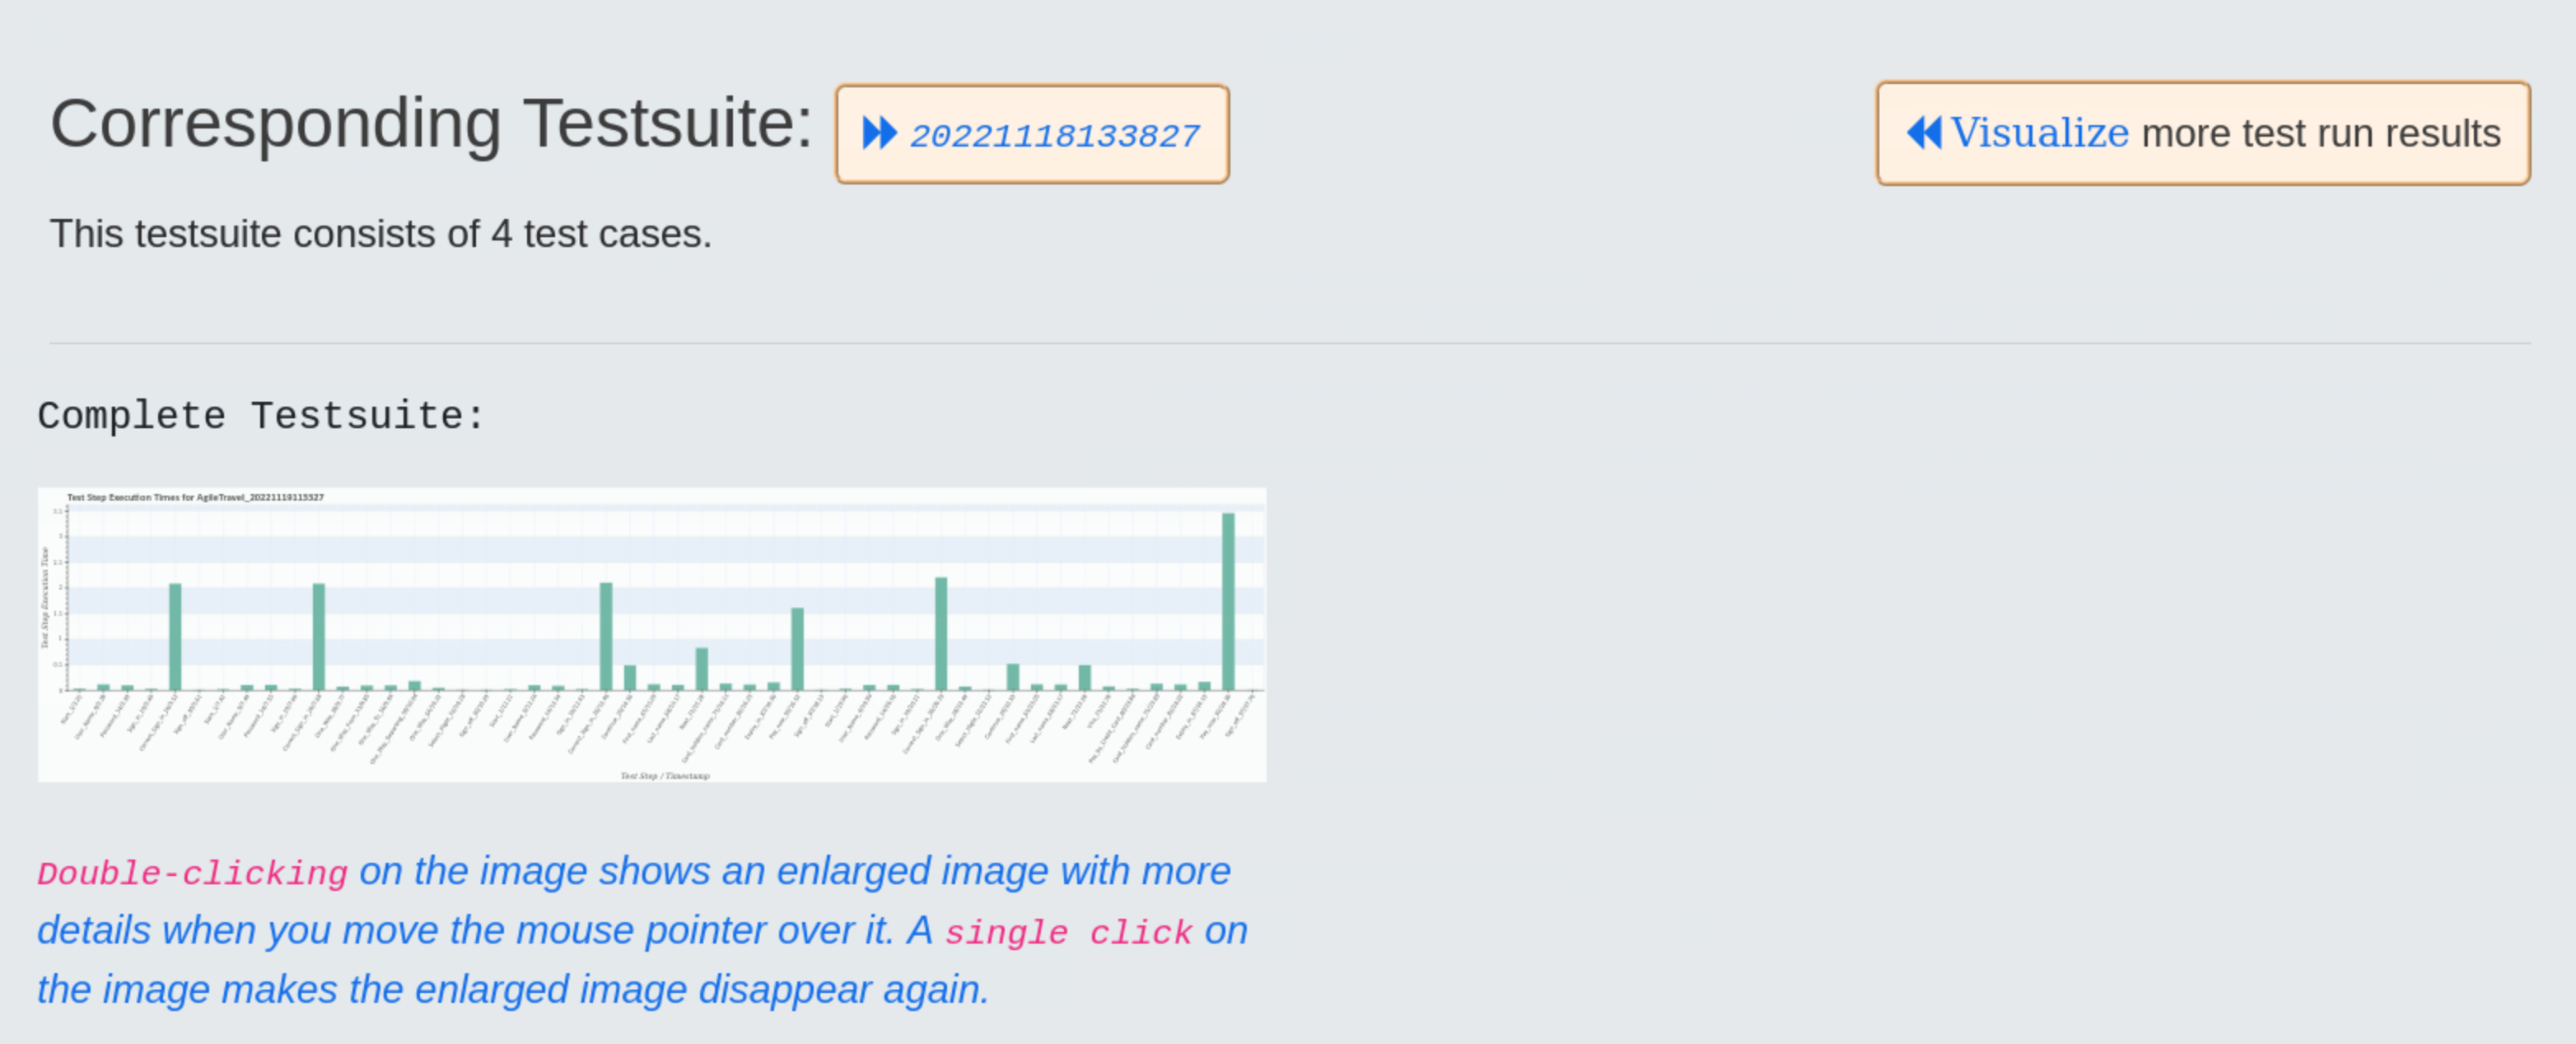
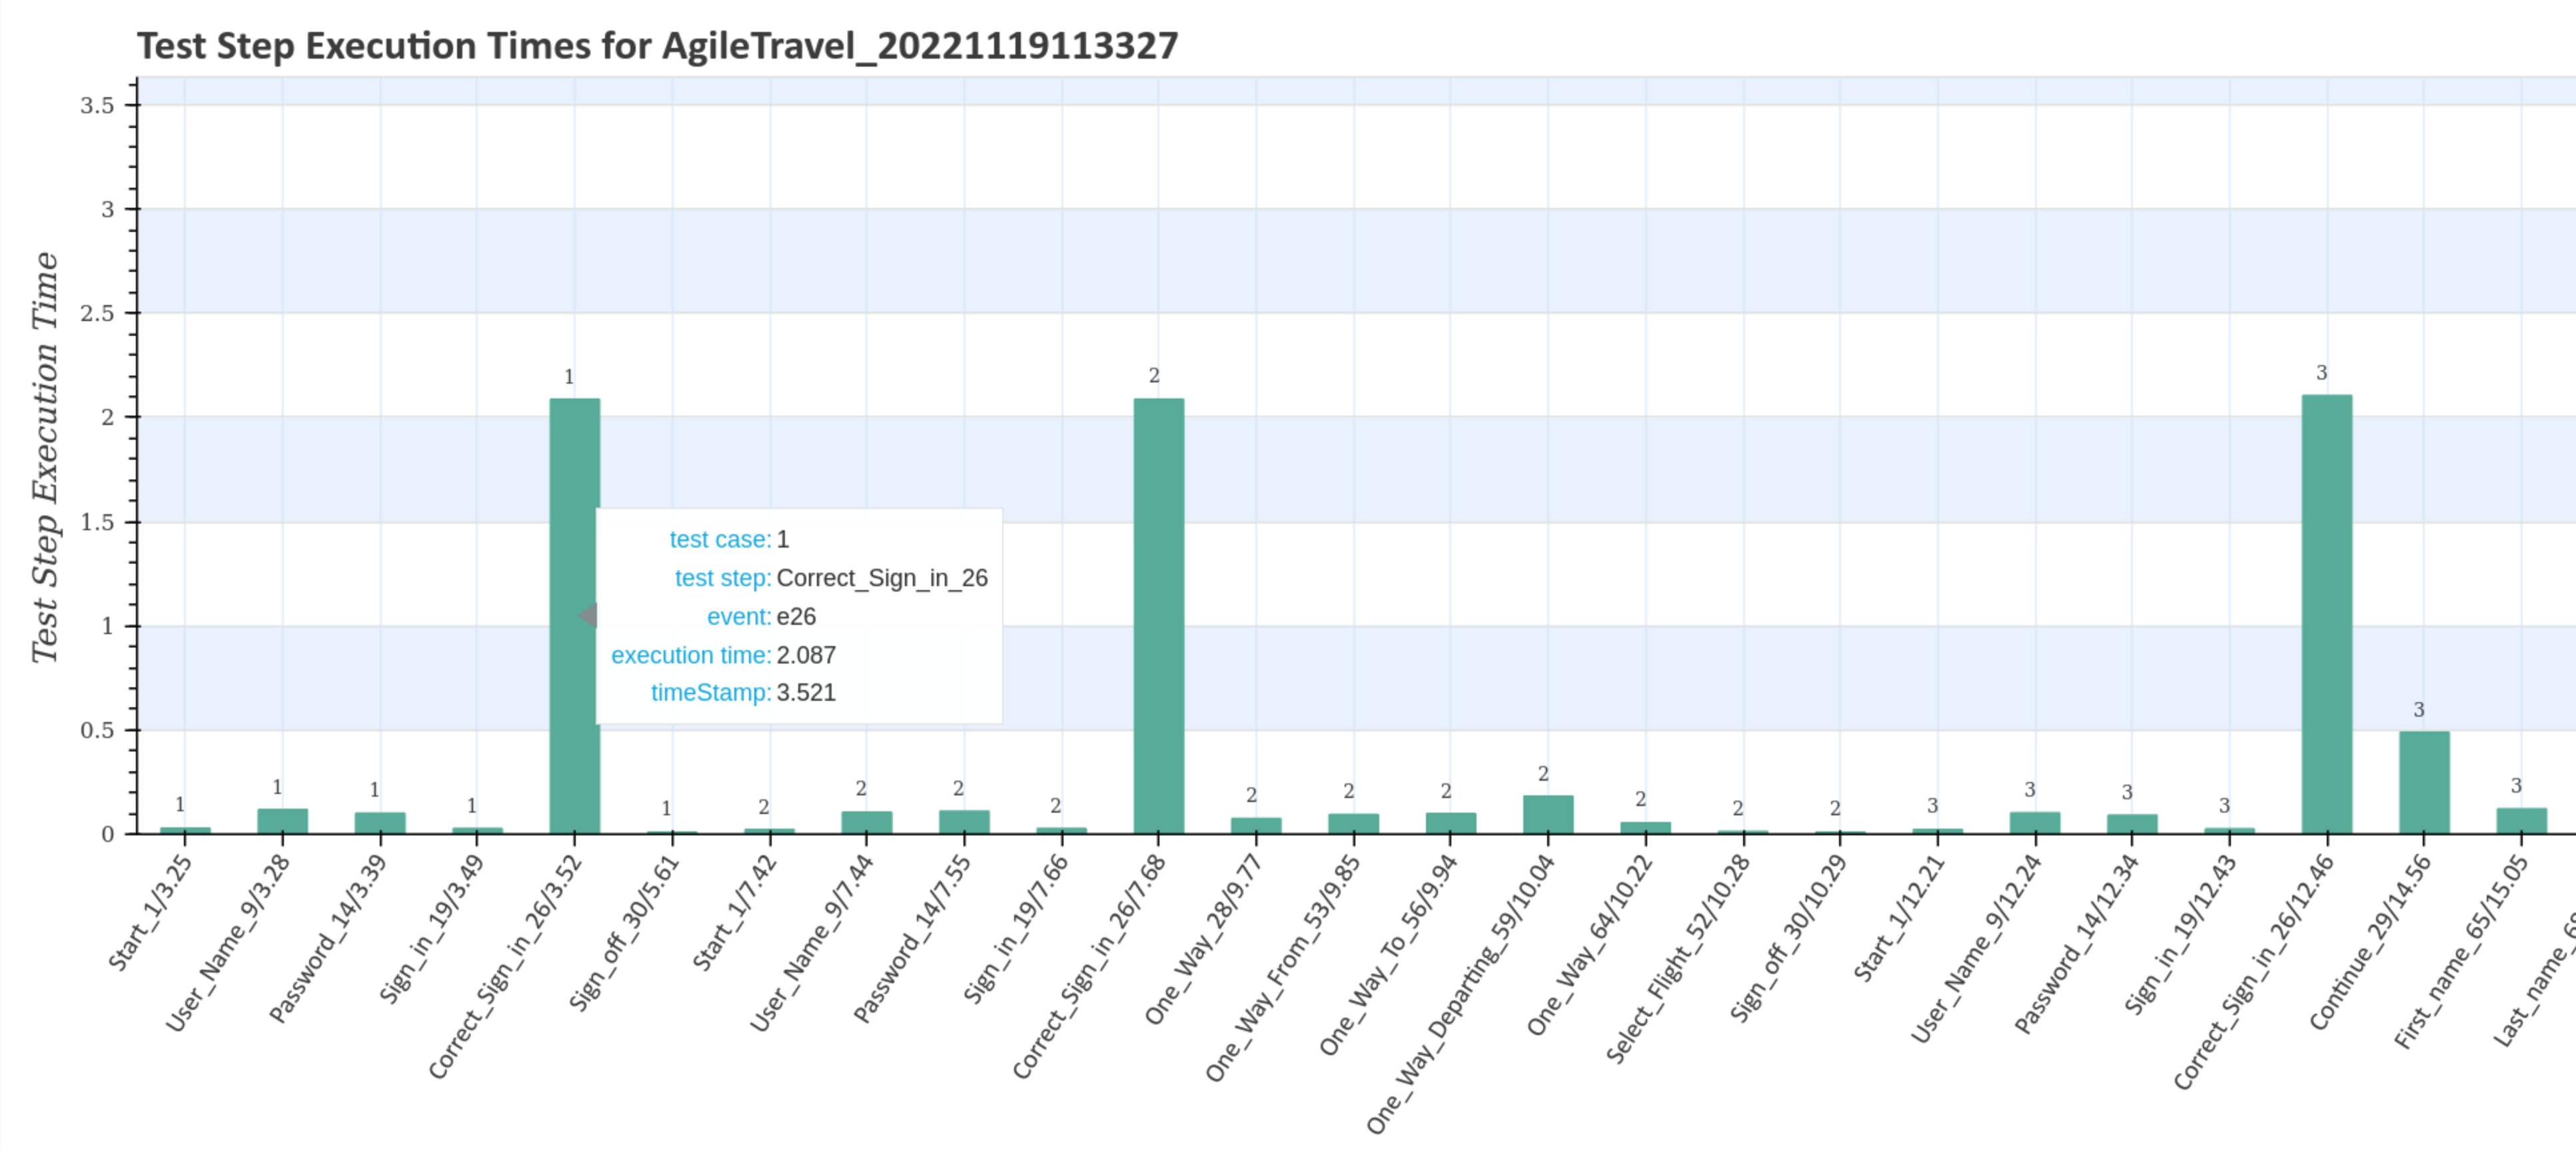
The larger diagram shows the test case numbers and transition events associated with the test steps, as well as the corresponding execution time and timestamp.
...
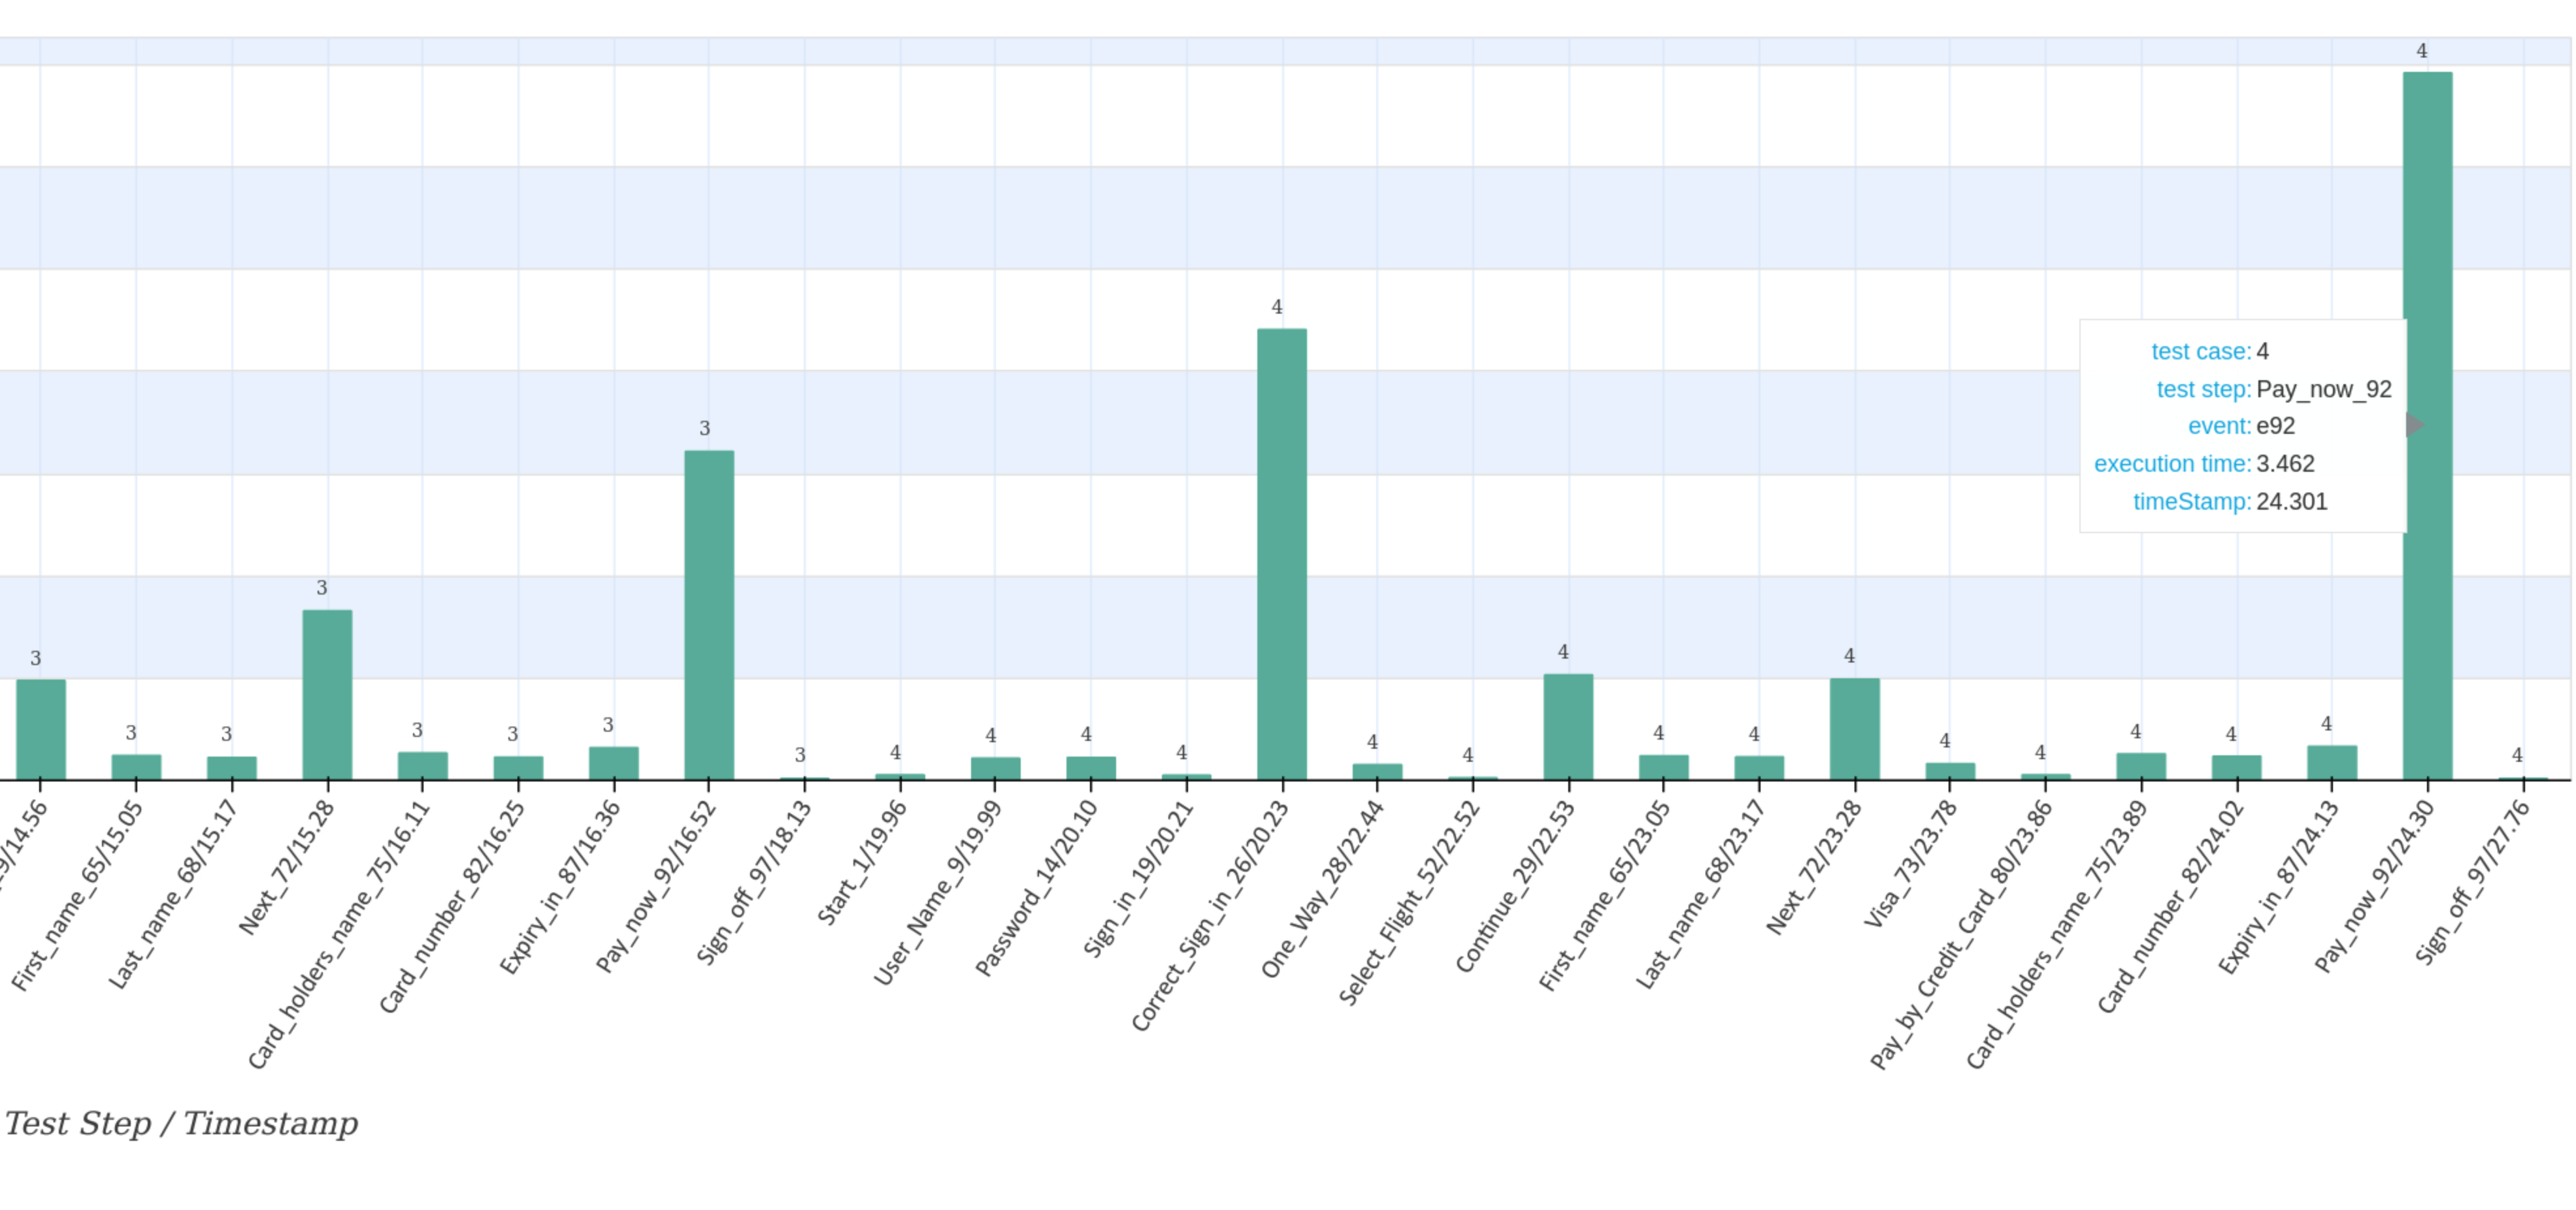
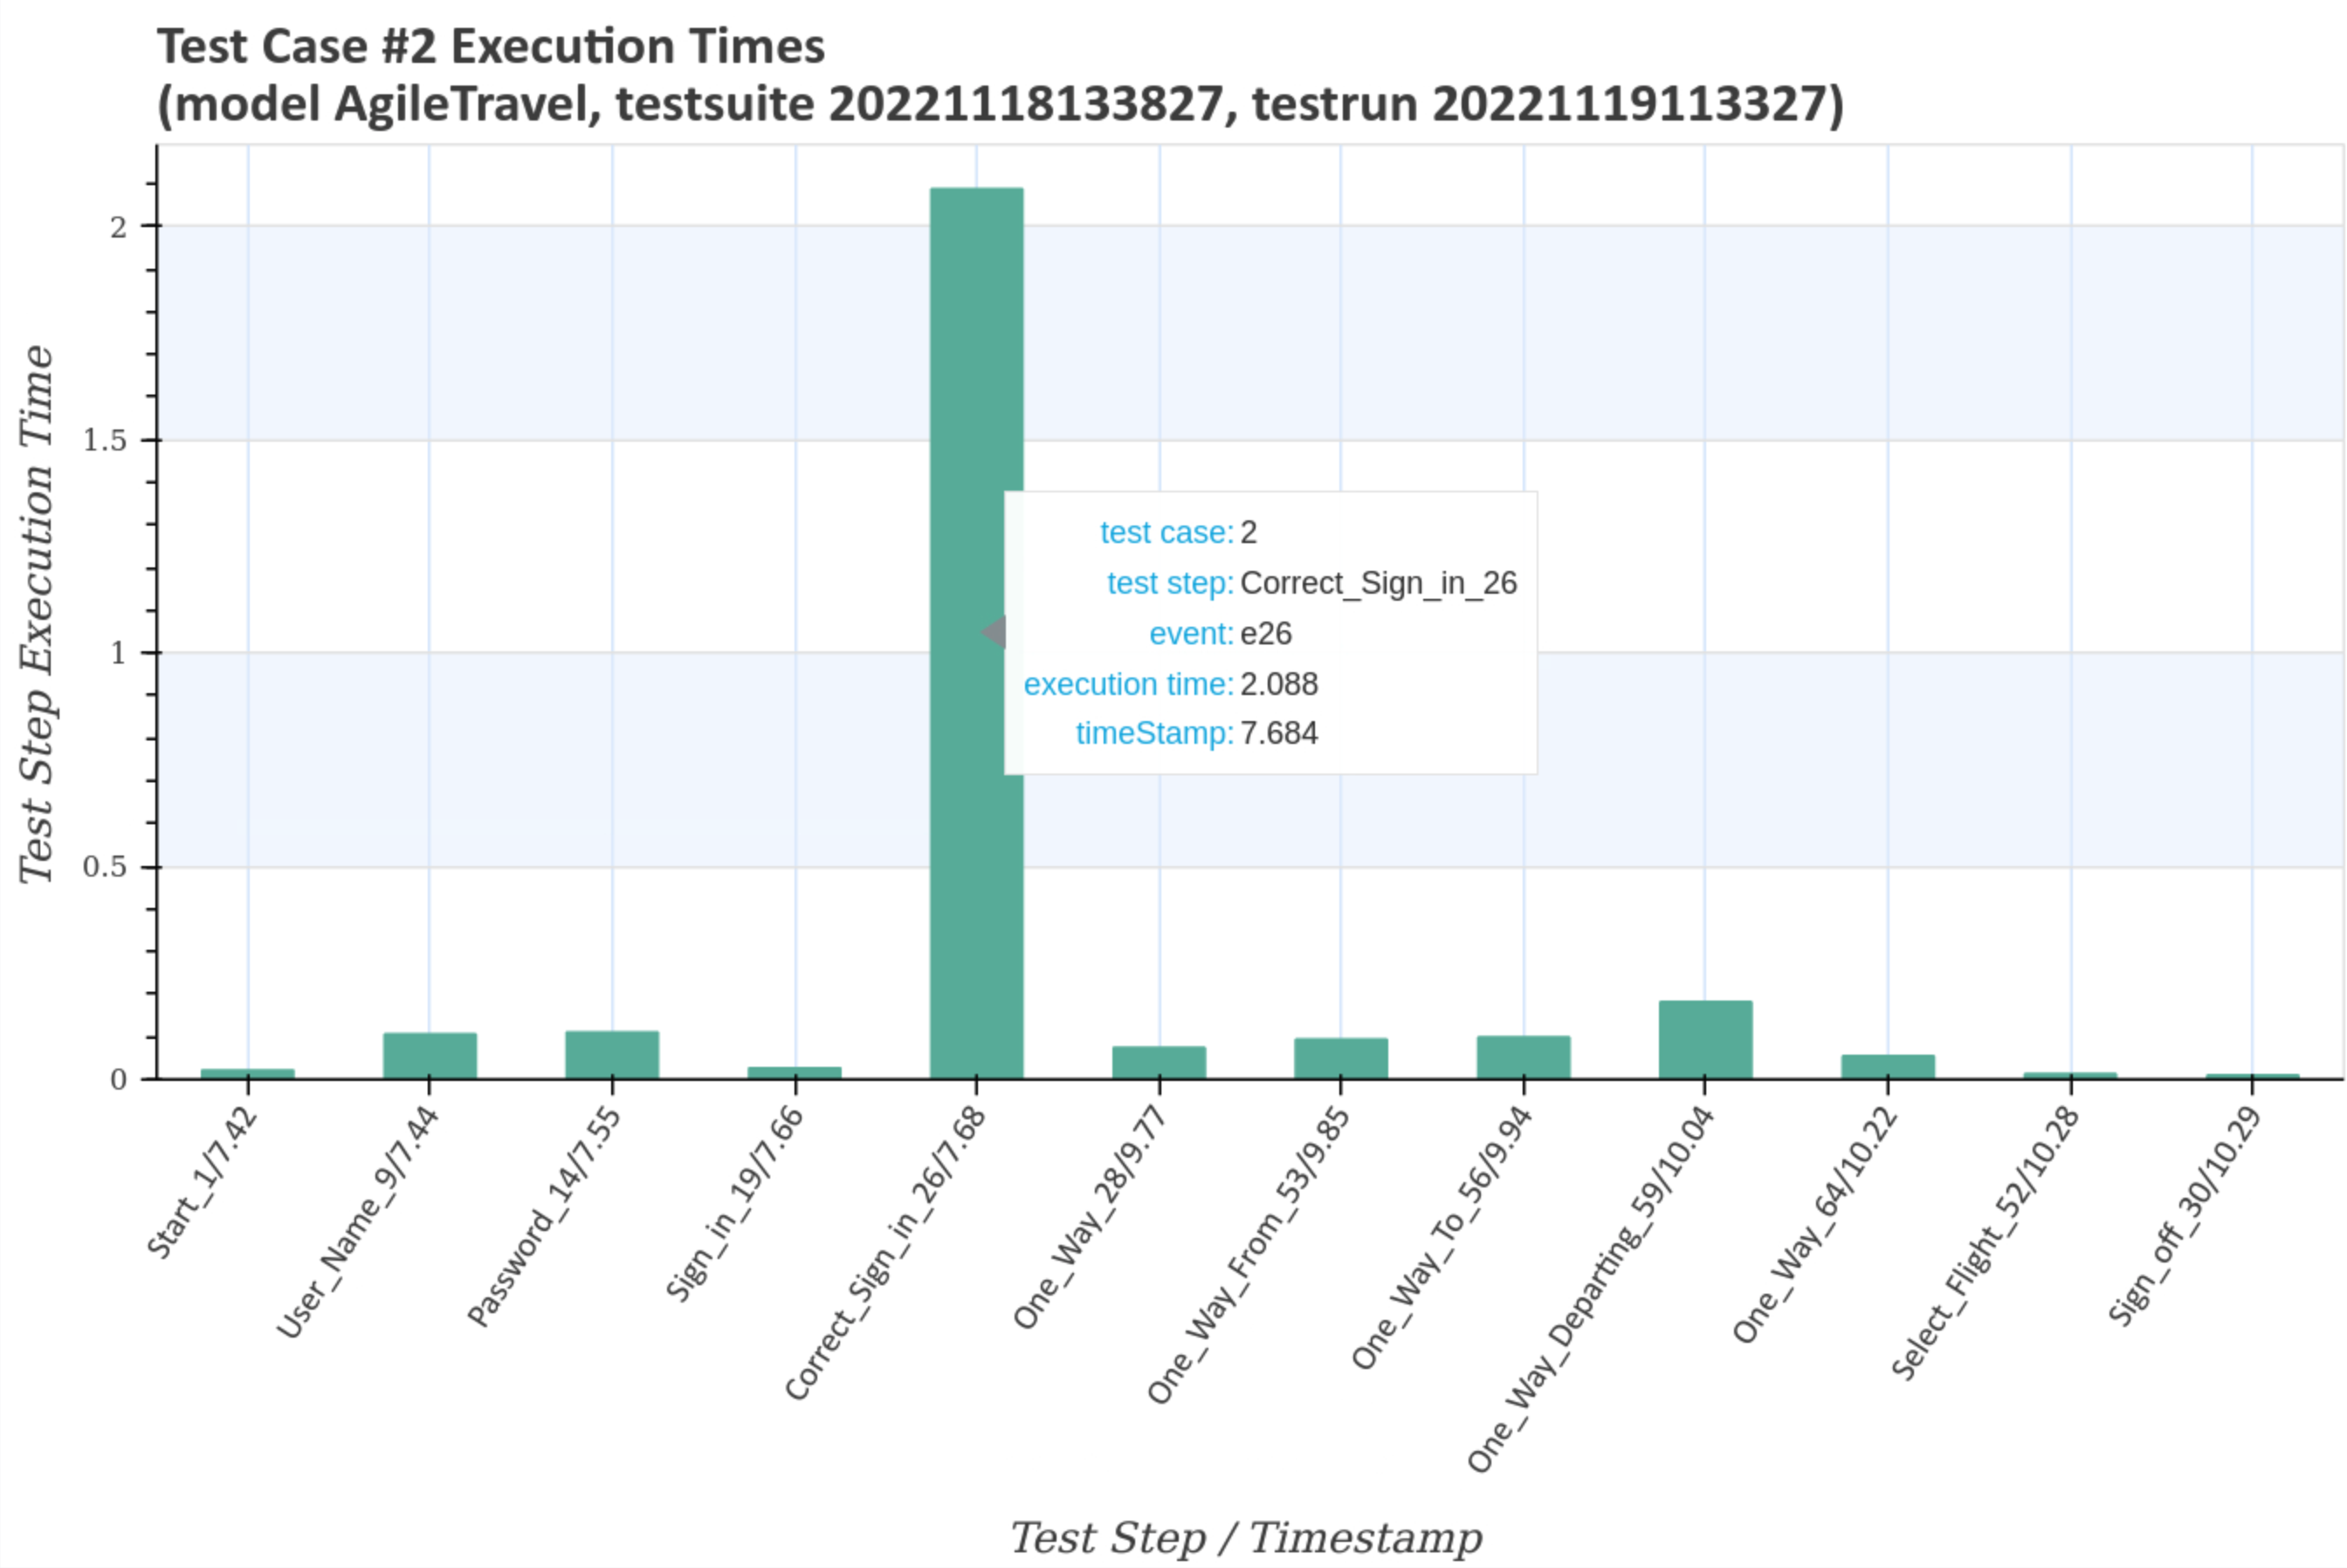
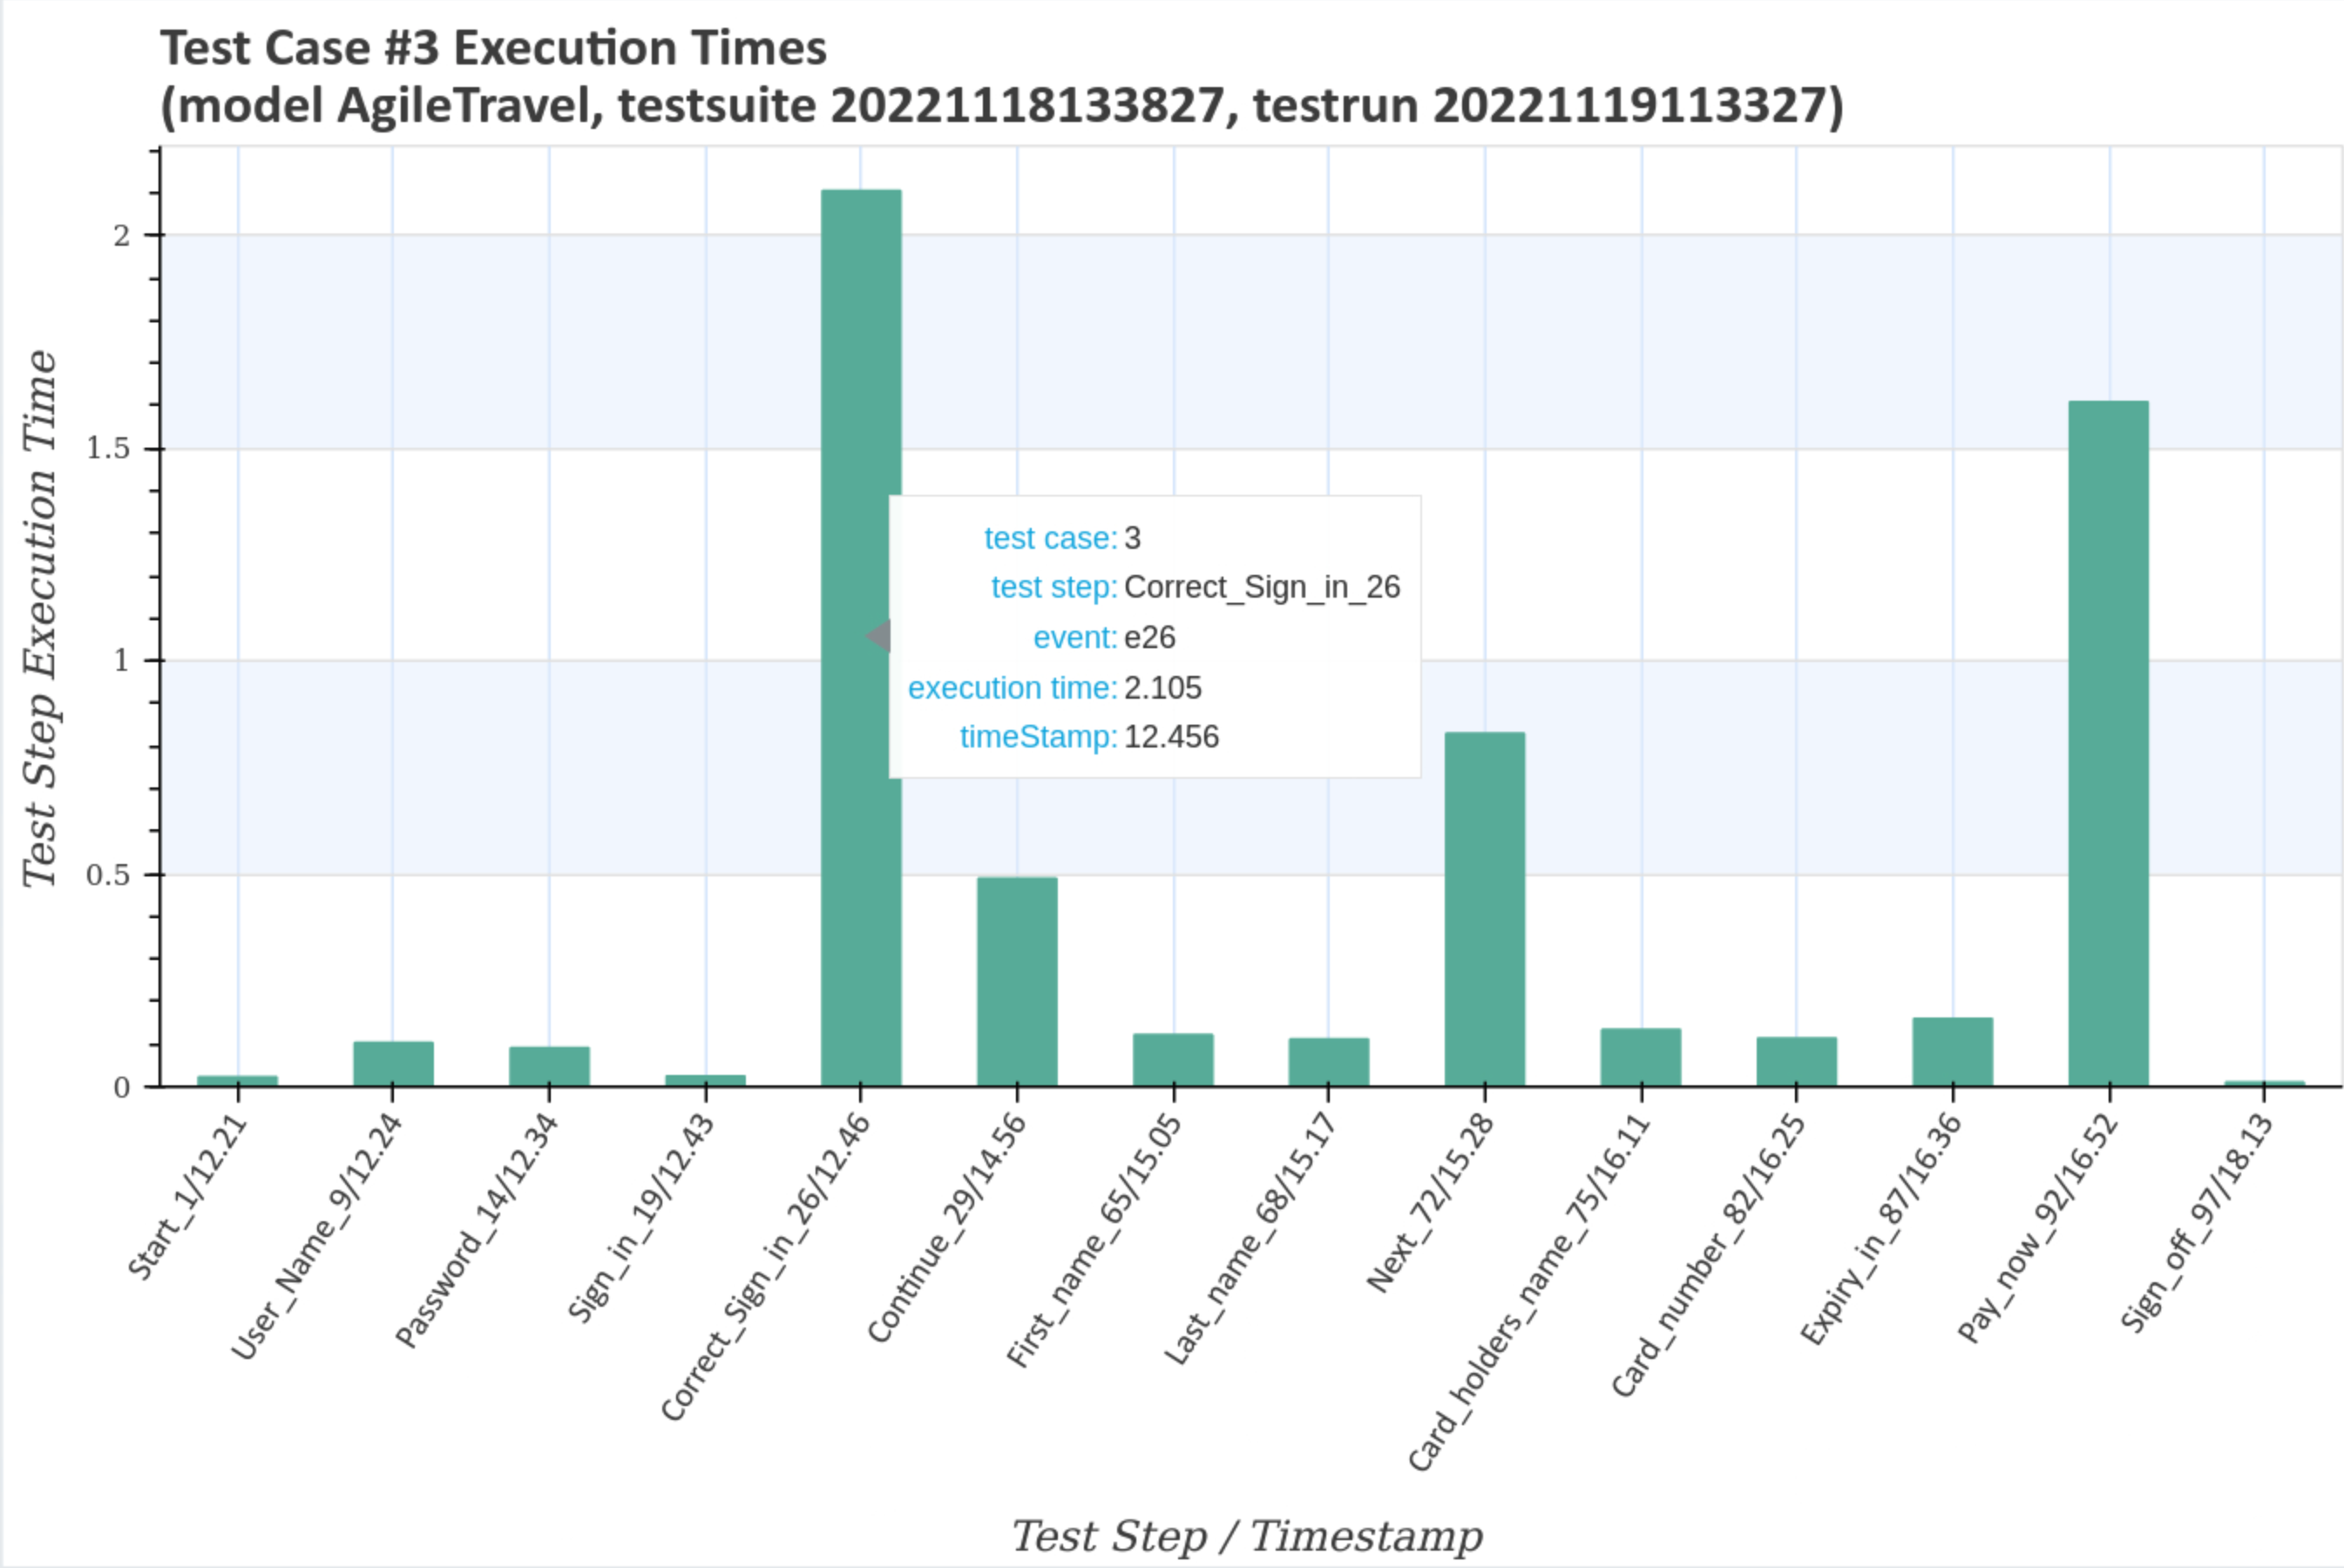
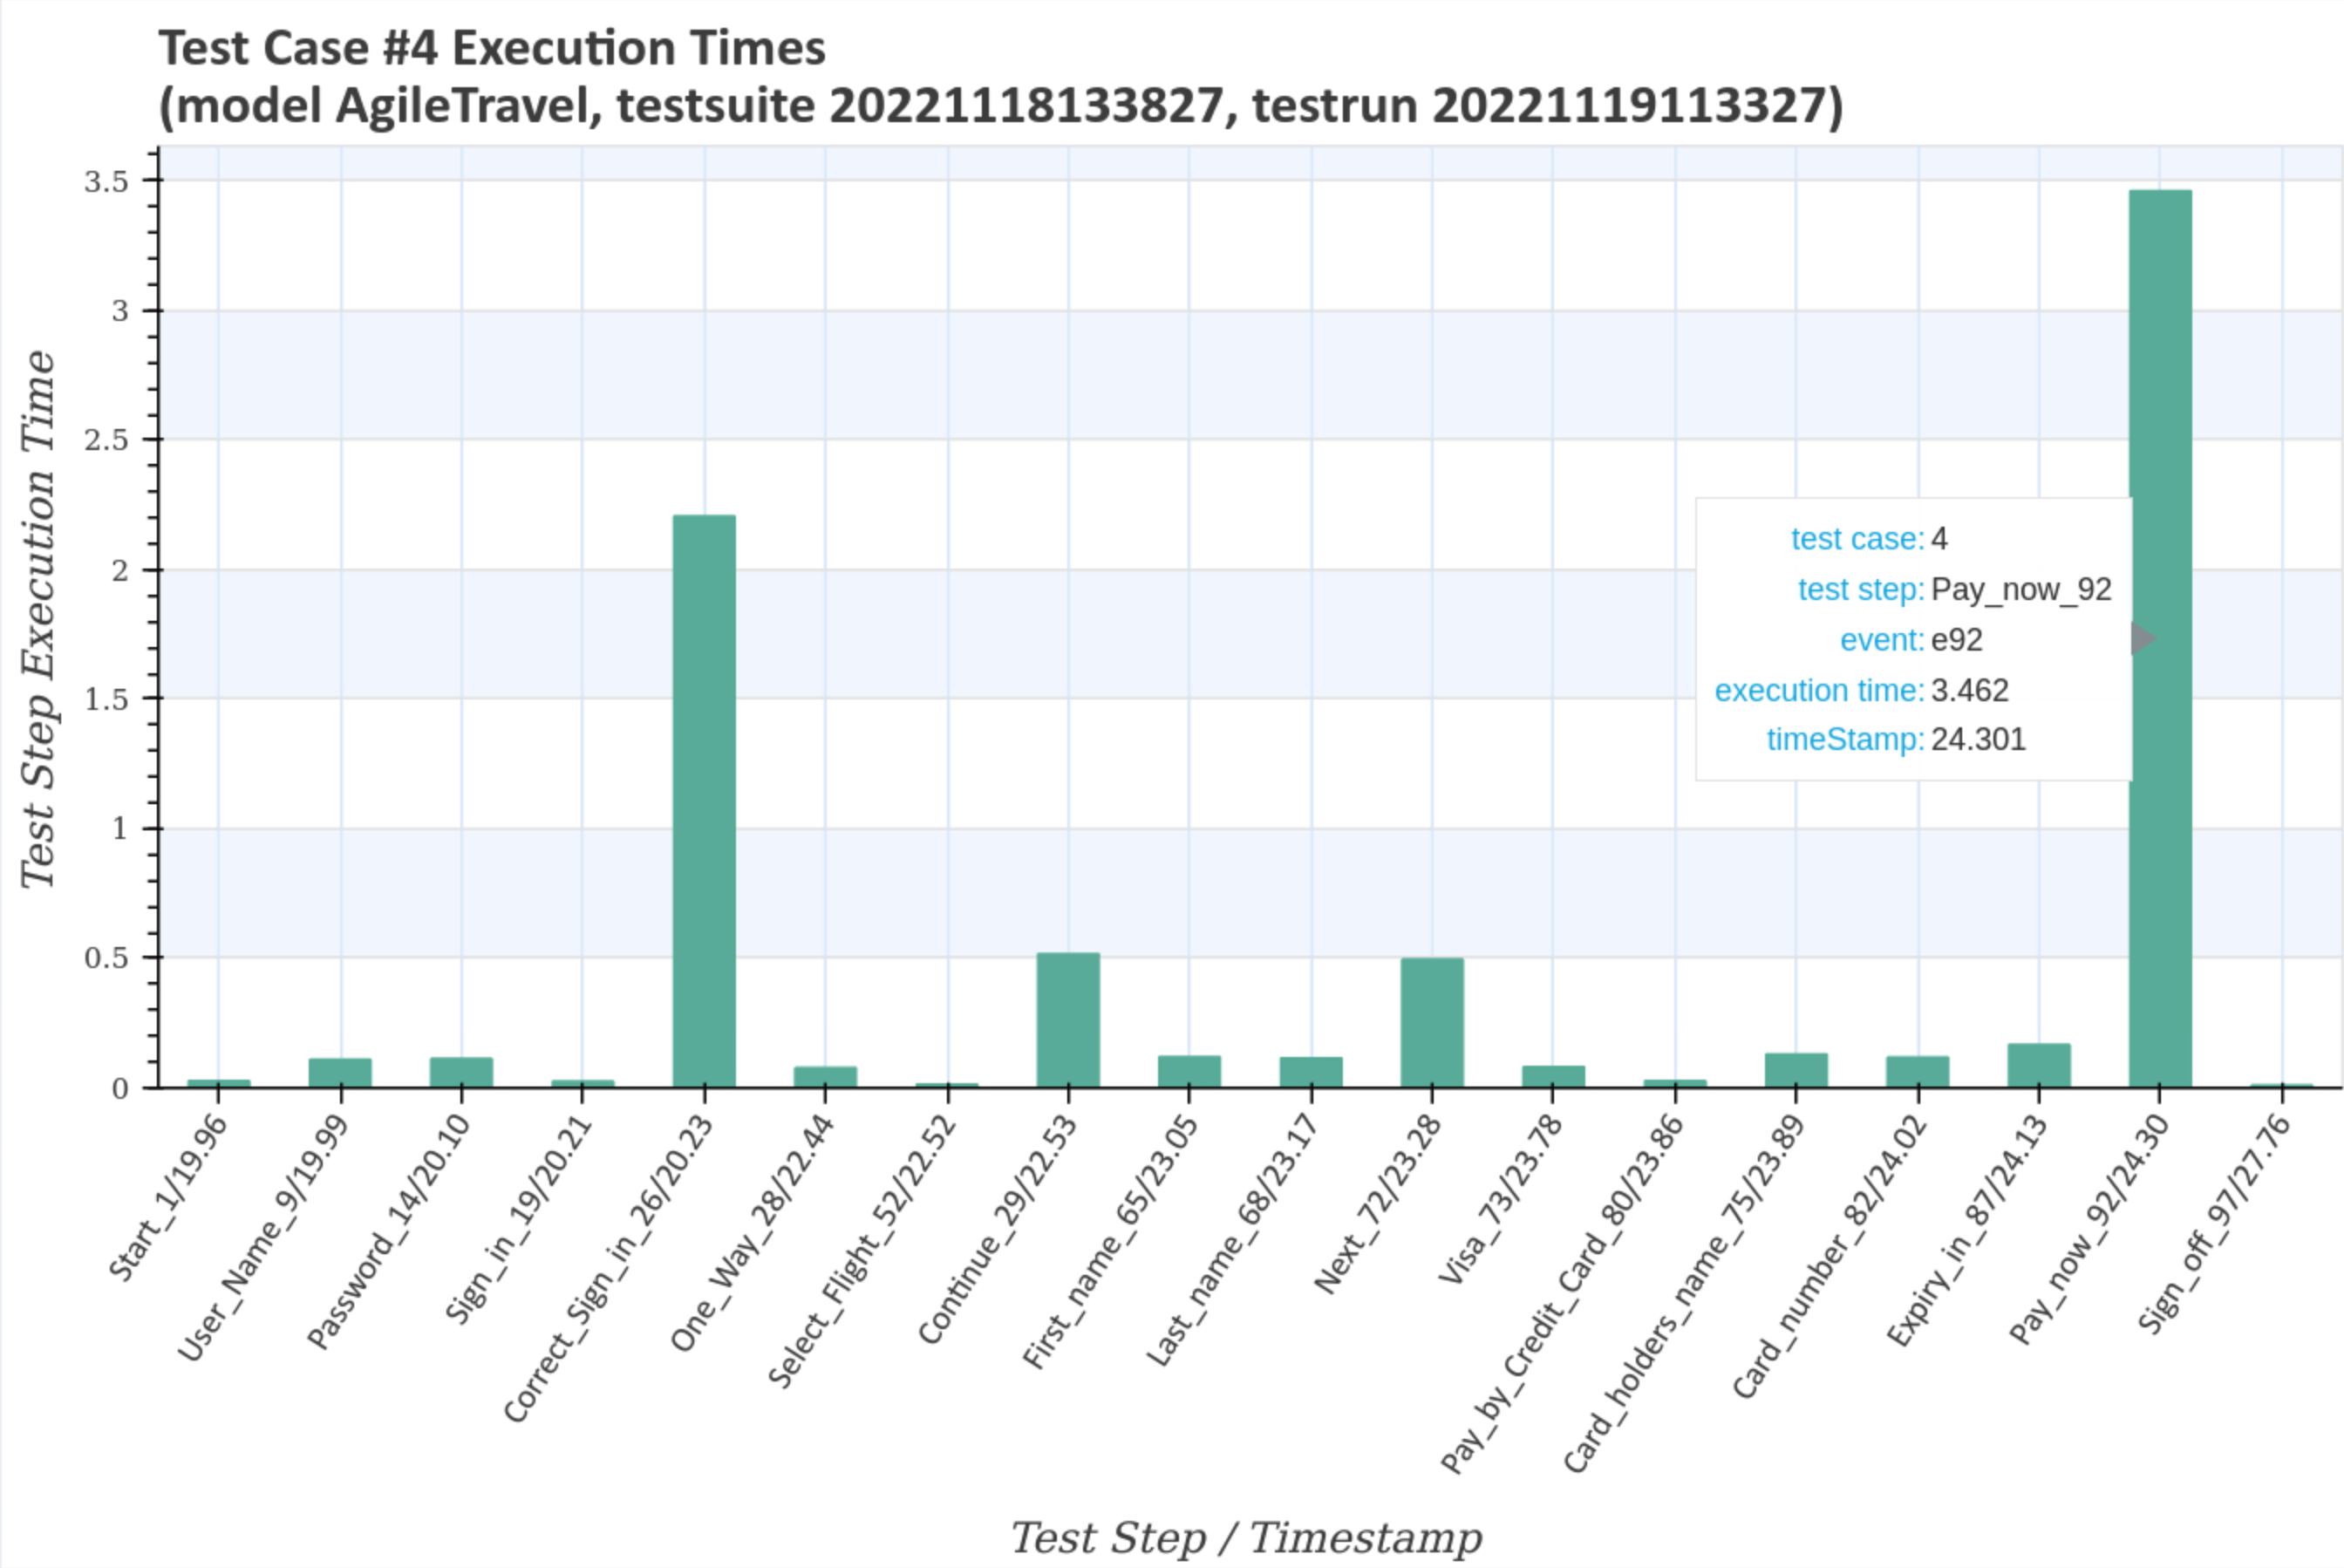
Subsequently, all test steps for all four test cases are displayed with the corresponding detail diagrams.
Visualize test step frequencies
Test step and transition event frequencies of individual test cases in relation to the selected test run and the associated test suite are visualized after pressing the blue Generate diagrams button and the Visualize link.
The first diagramm gives an overview of the transition event frequencies for the test suite with the unique timestamp 20221118133827. Double-clicking on the image shows an enlarged image with more details when you move the mouse pointer over it.
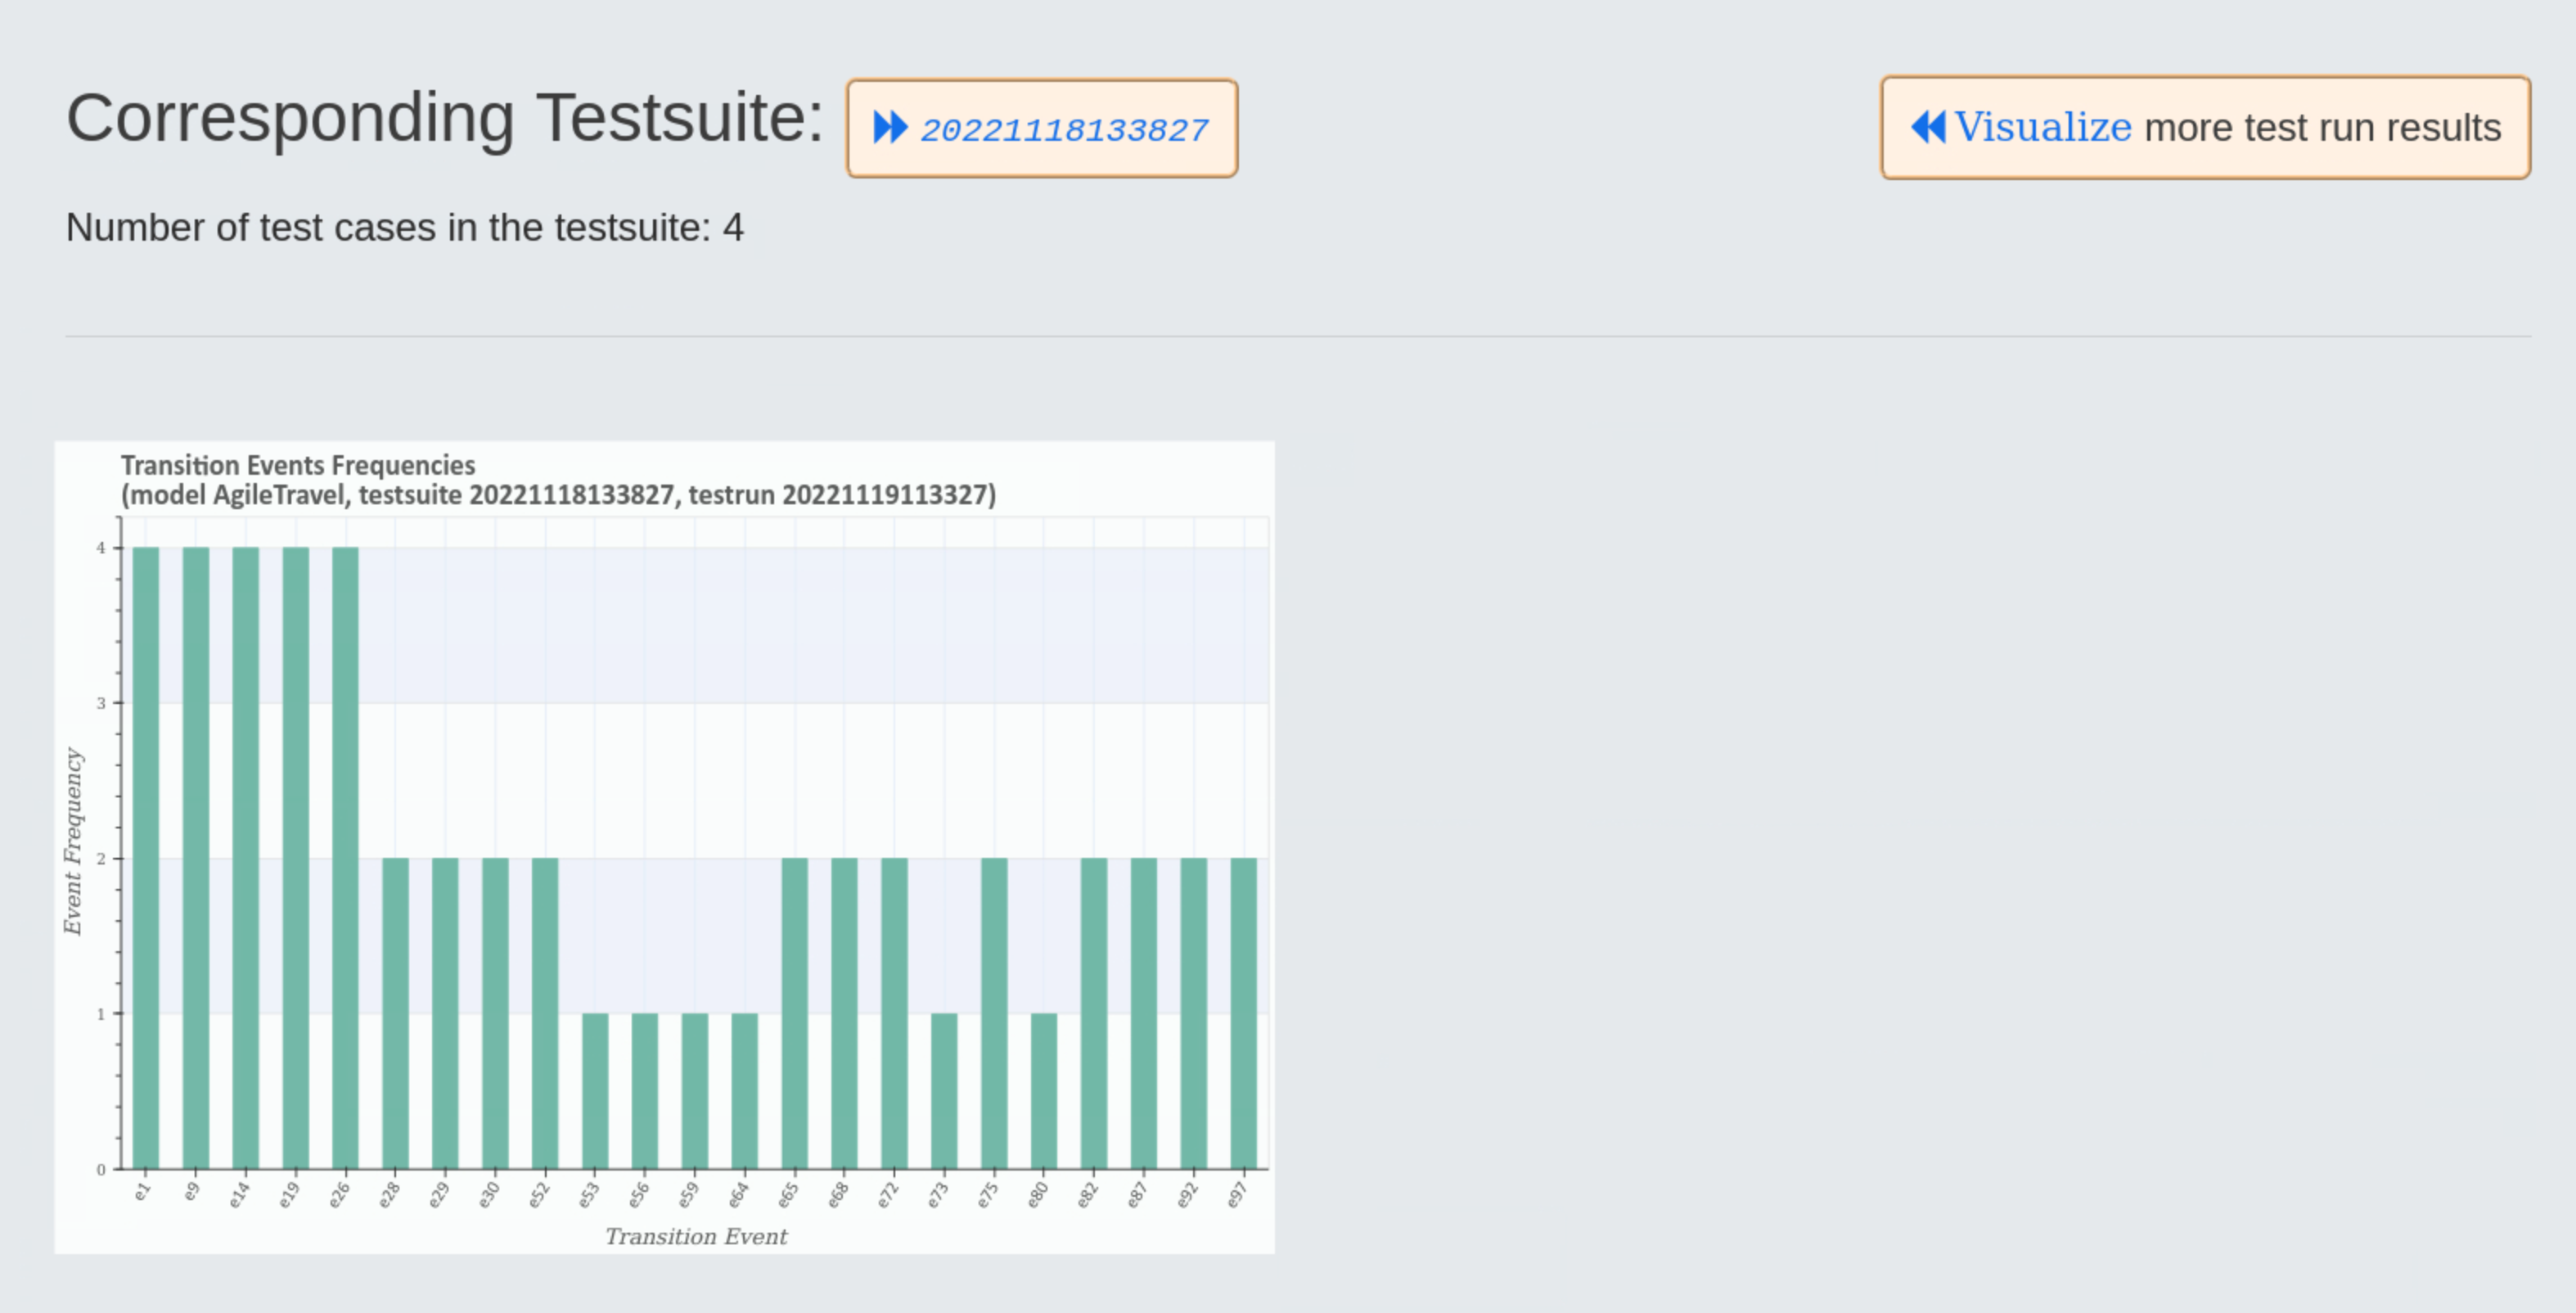
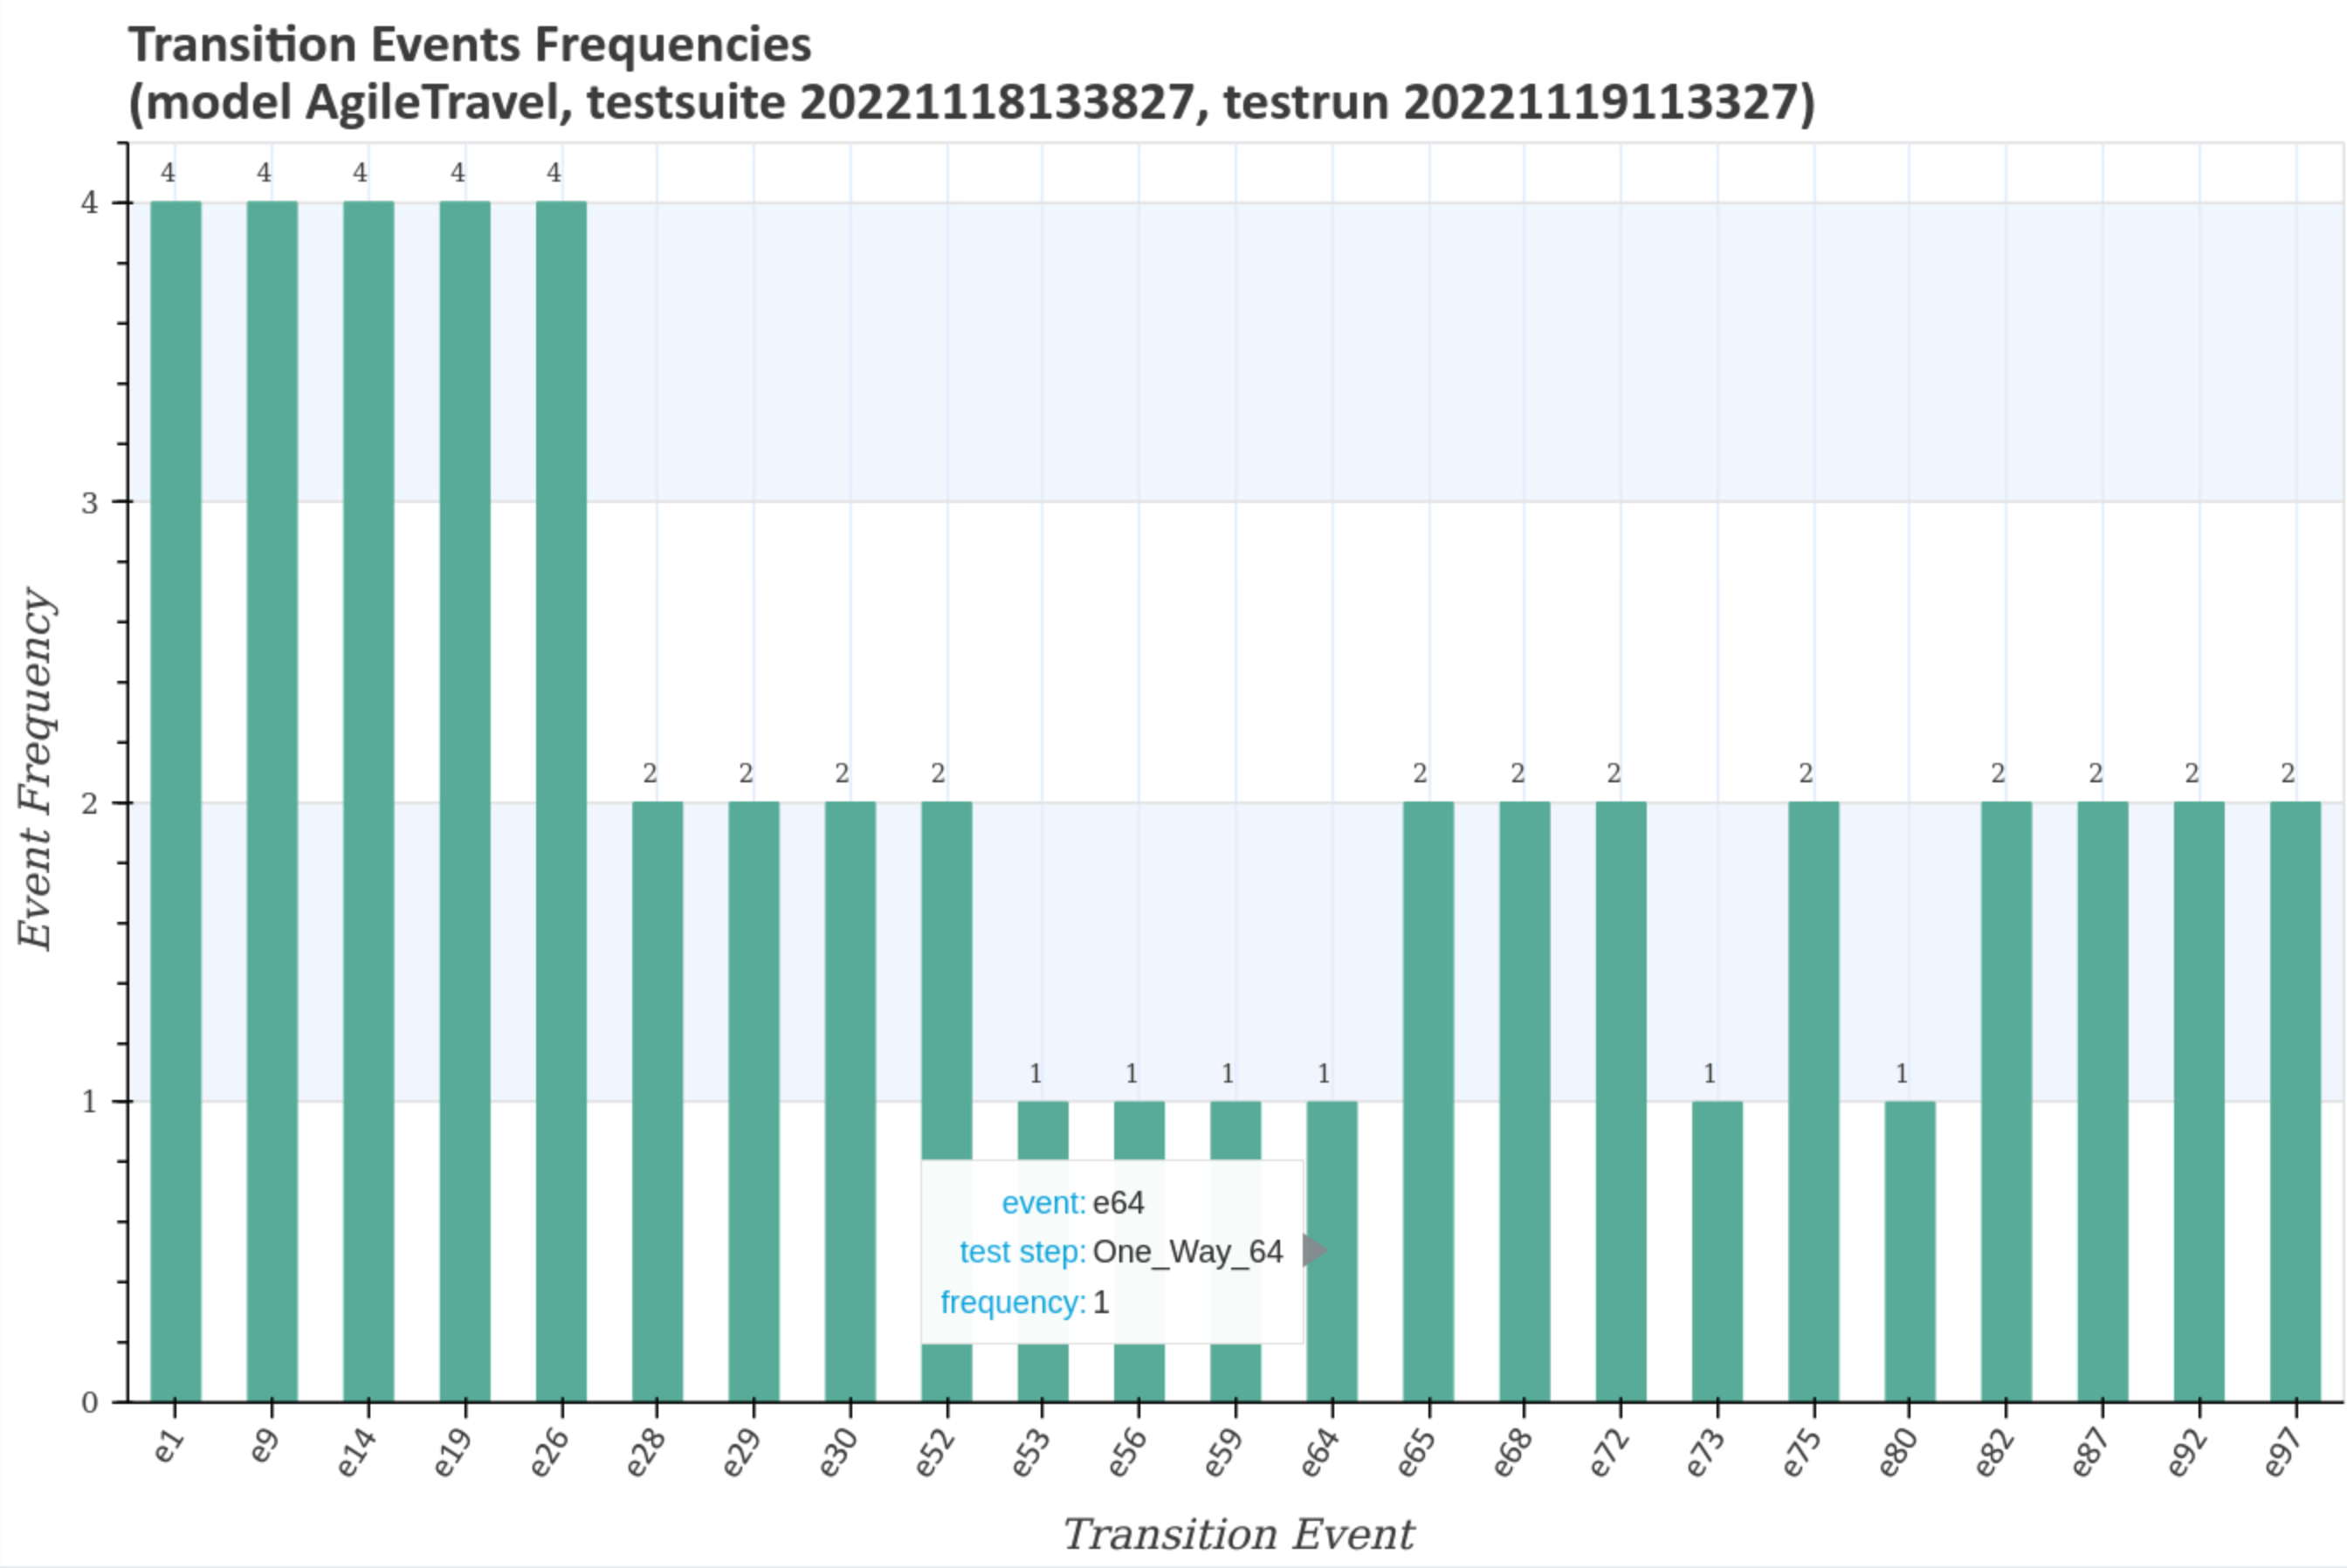
The larger diagram shows the transition event frequencies and the test steps associated with the transition event.
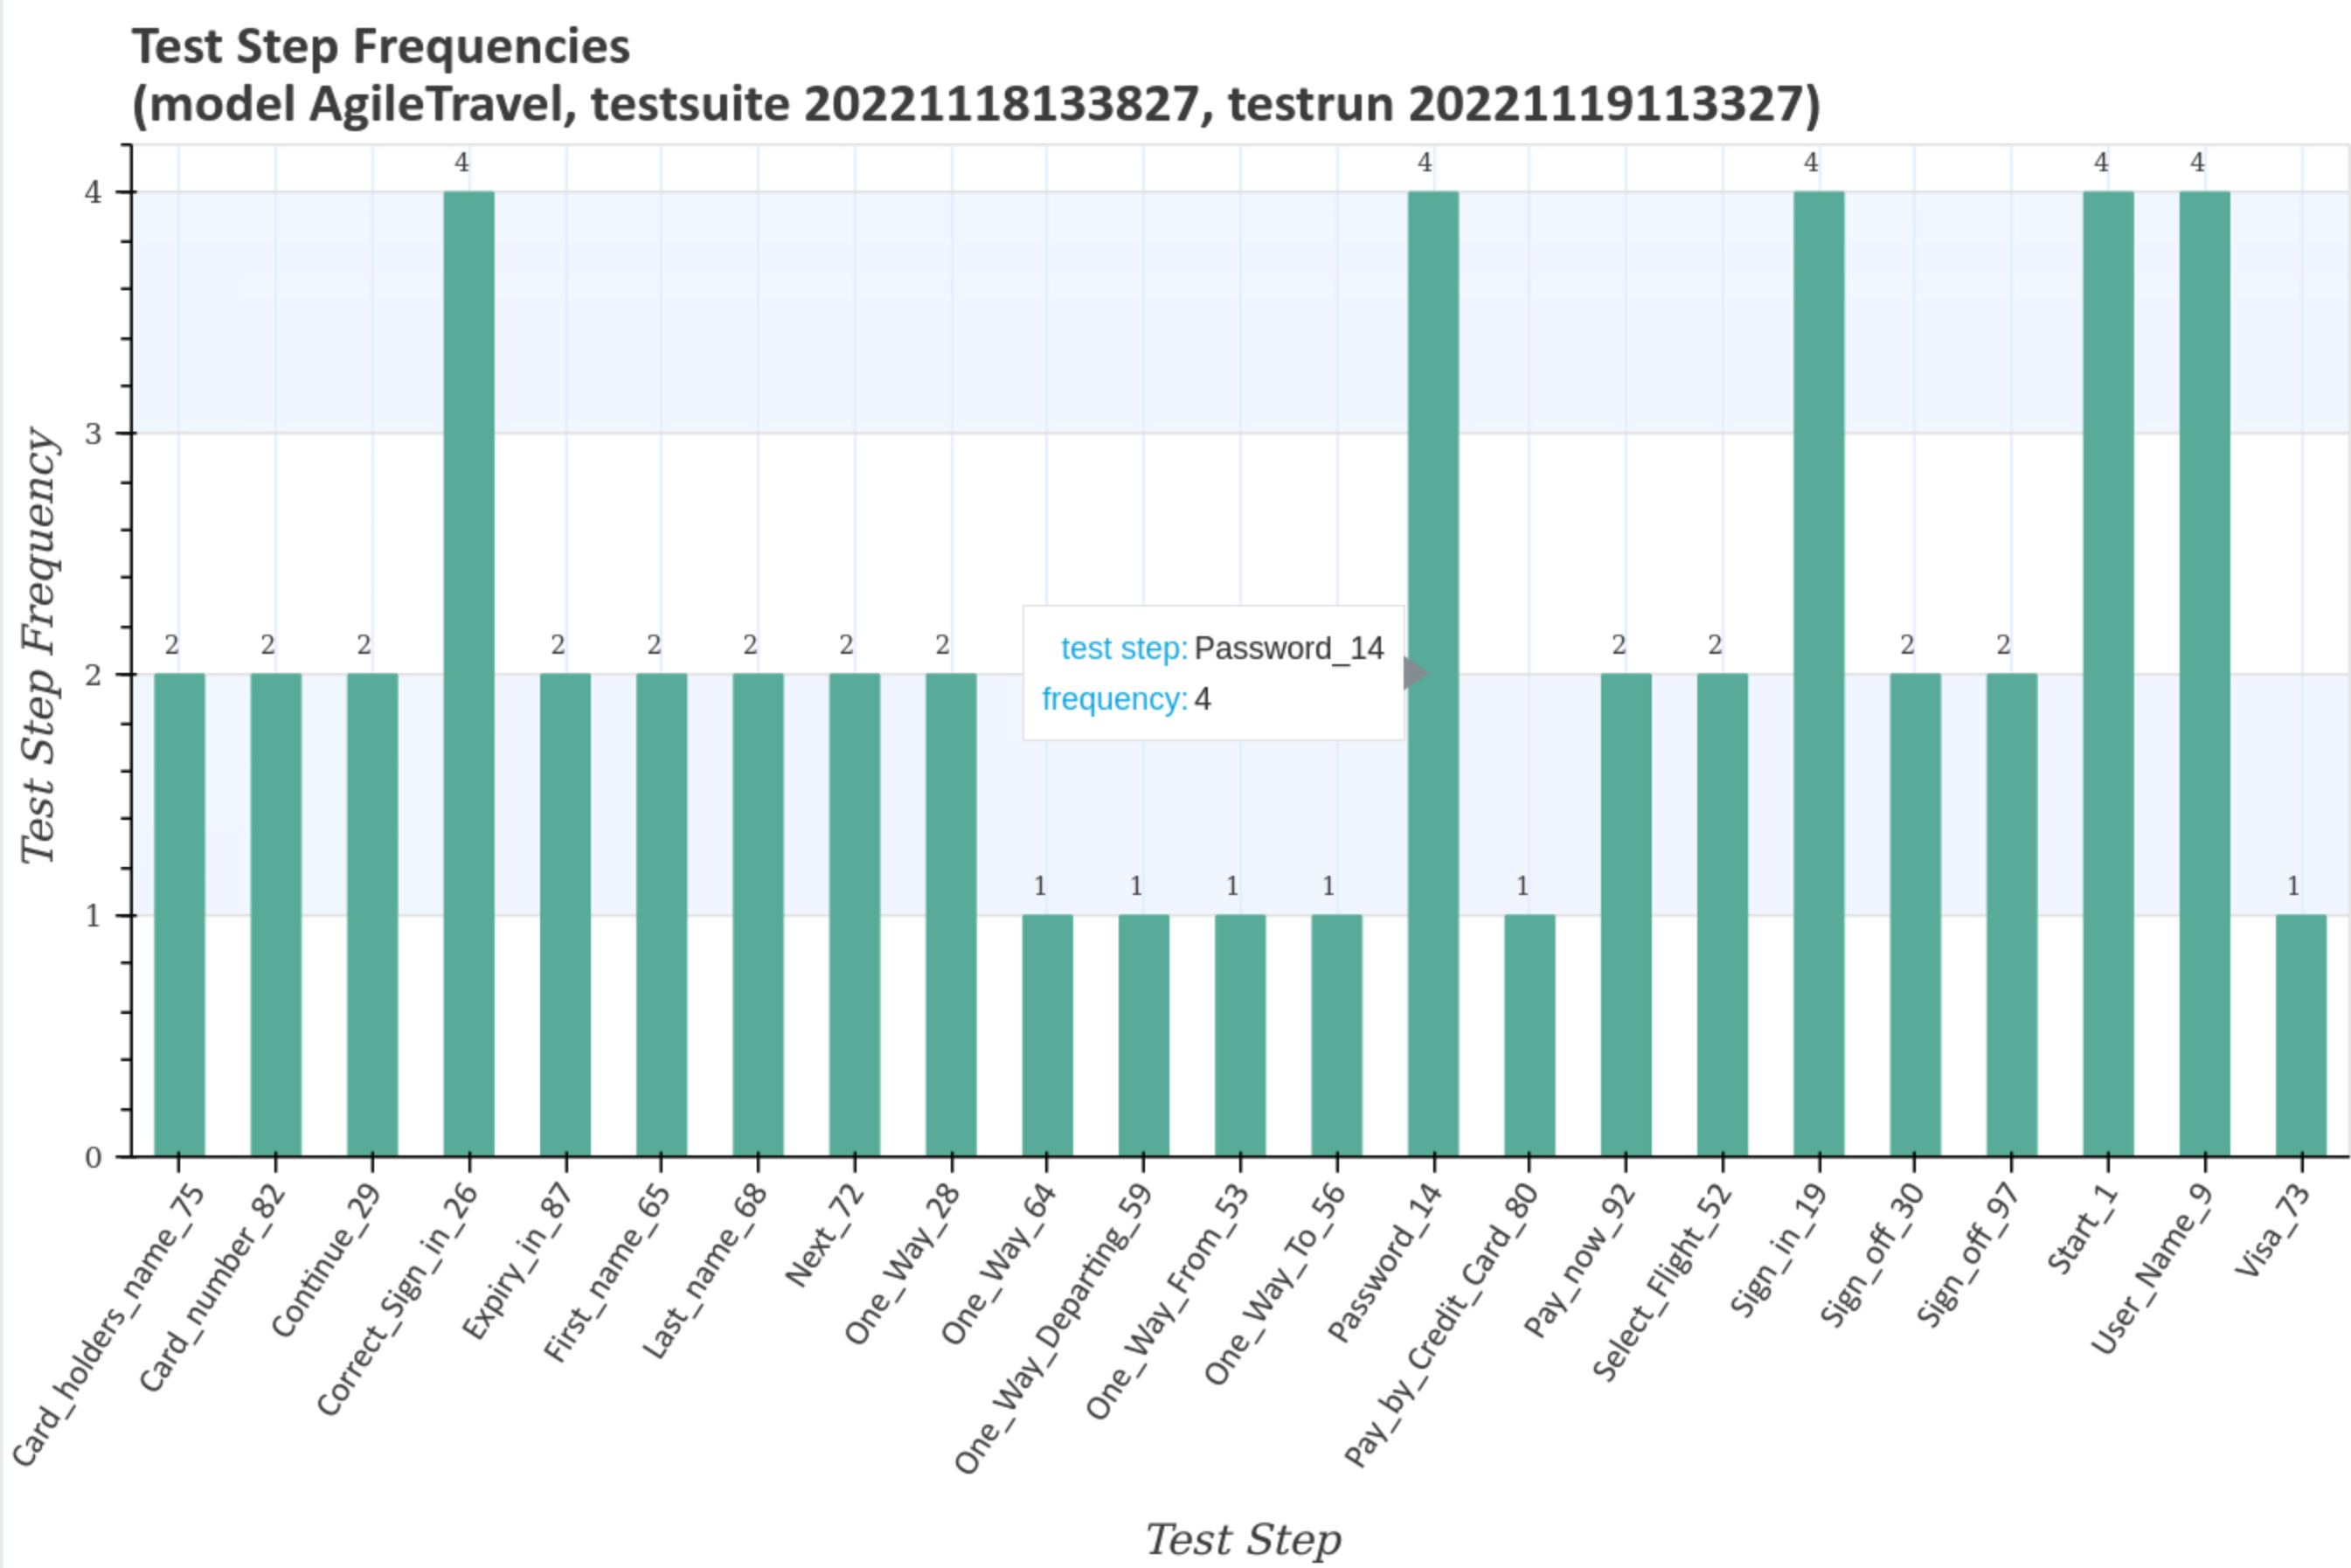
The next larger diagram shows the test step frequencies and the transition events associated with the test steps.
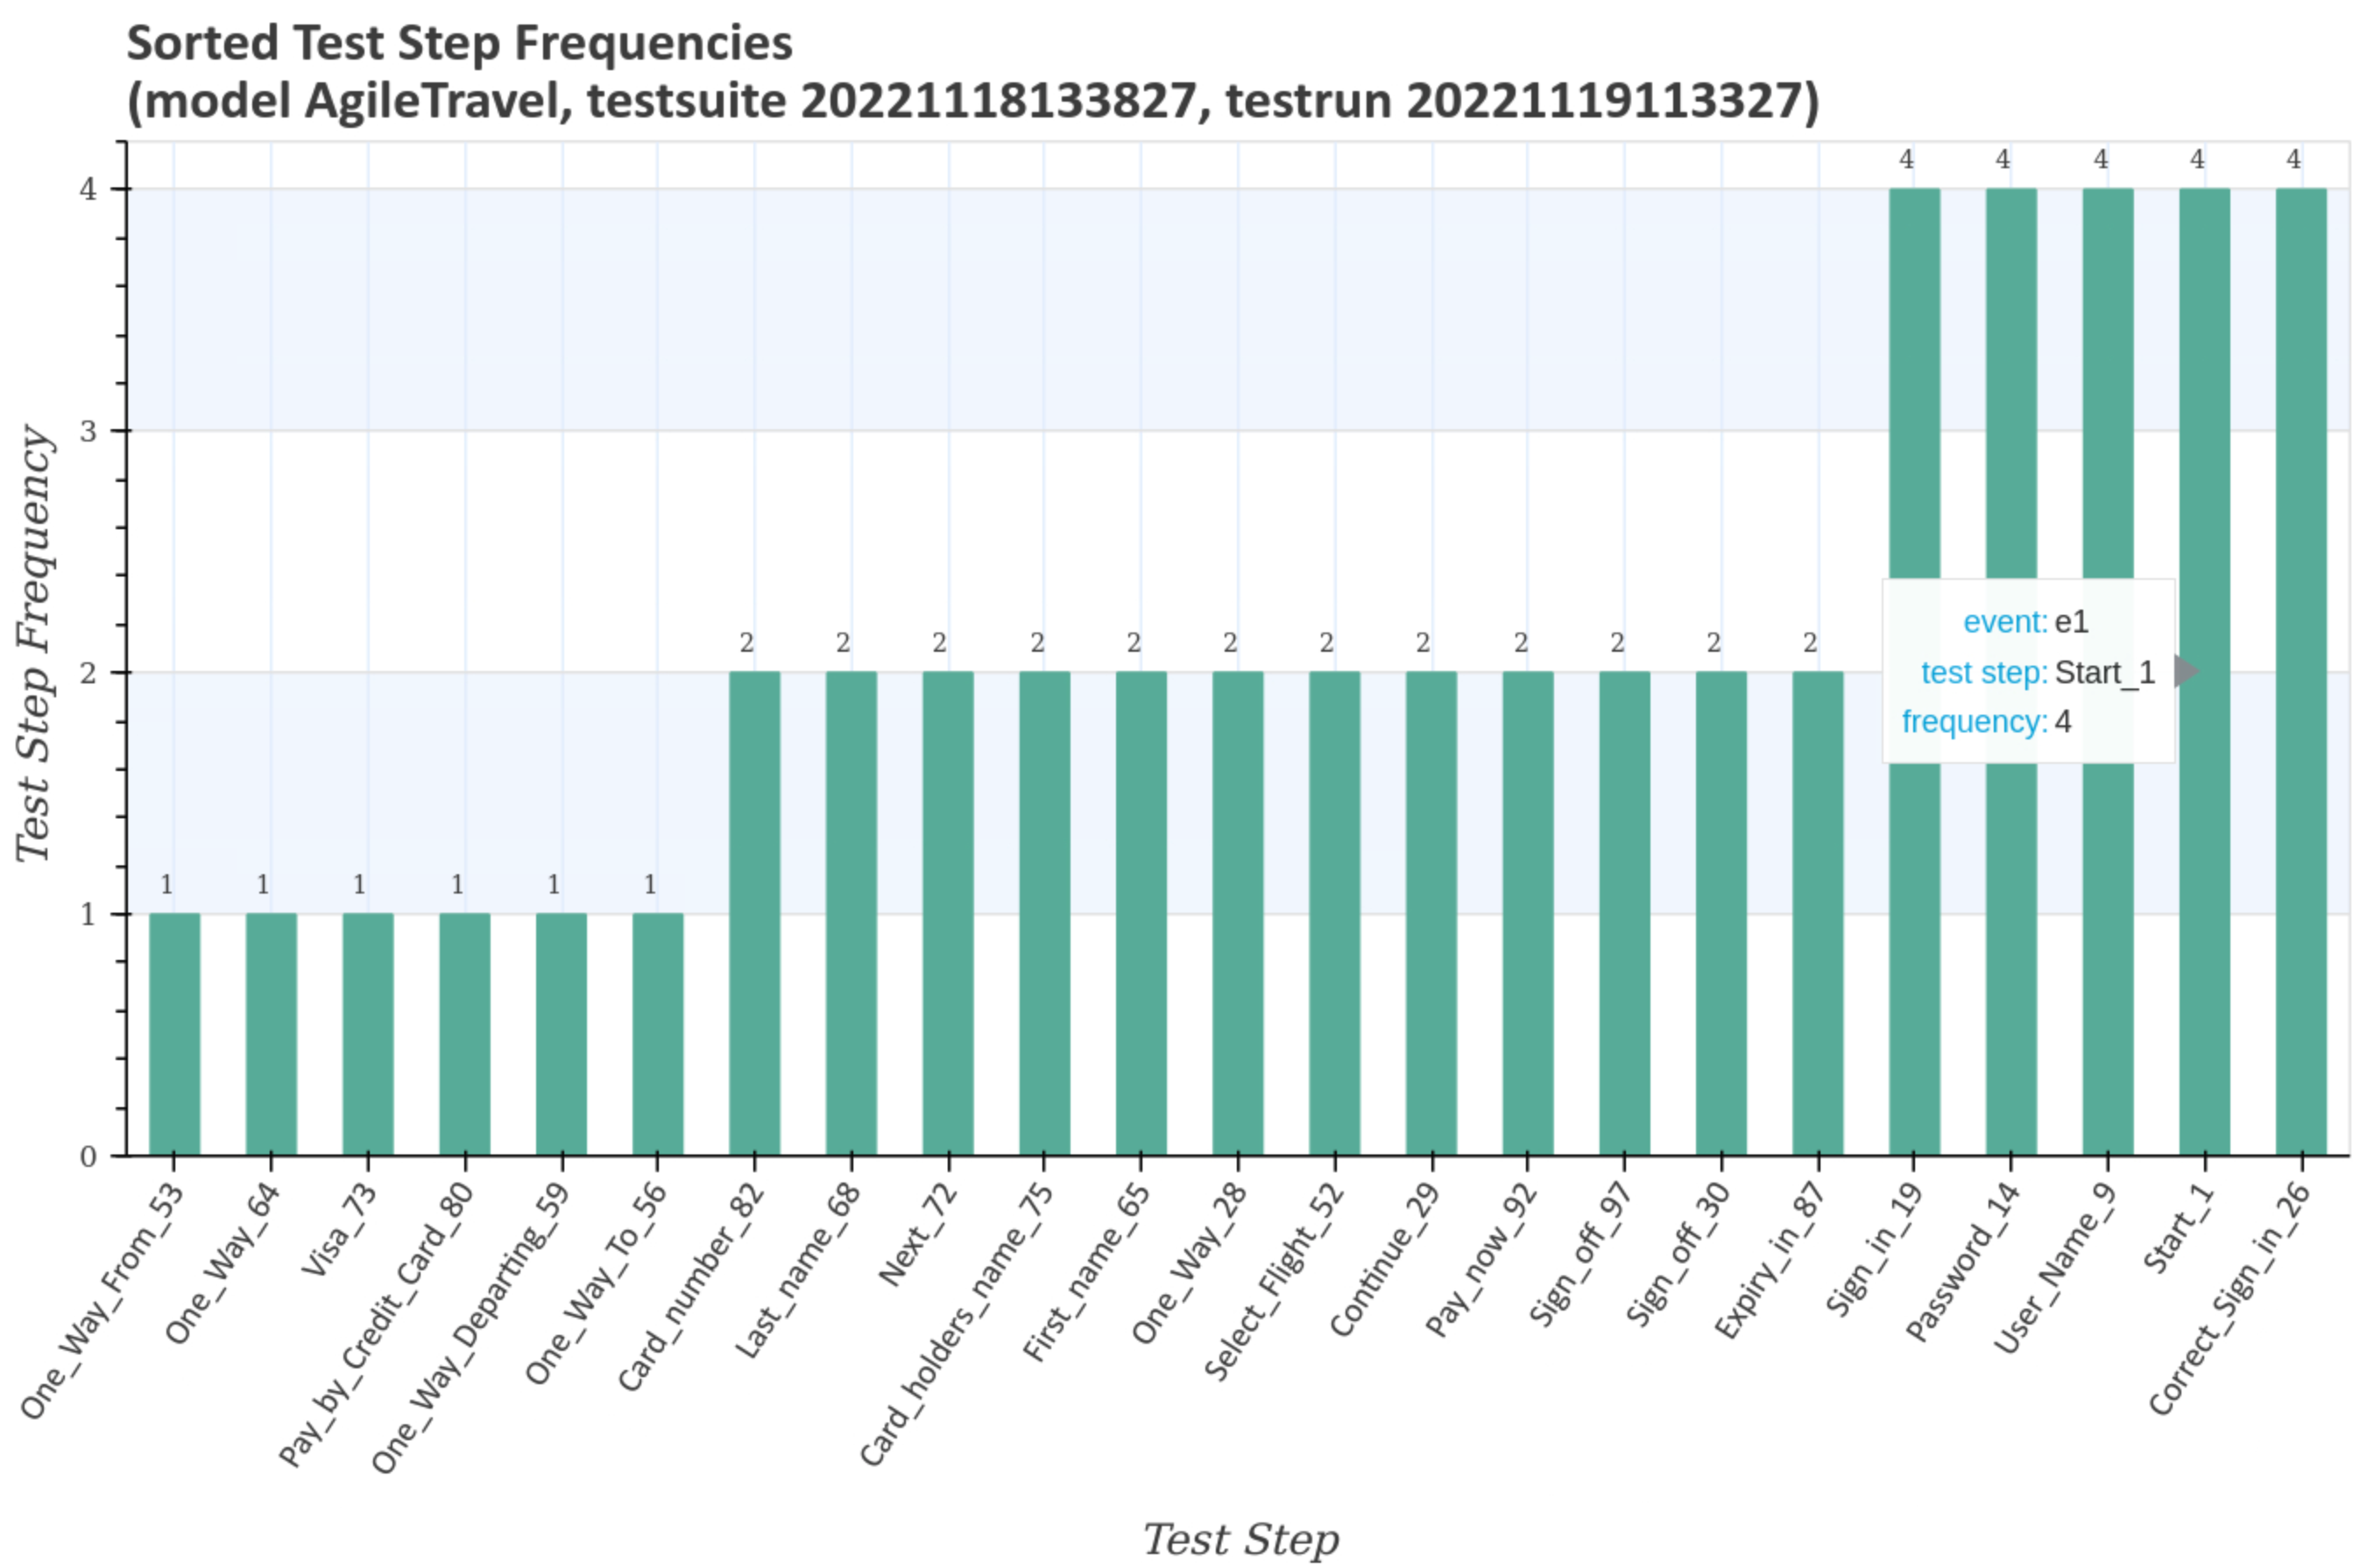
The last enlarged diagram shows the sorted test step frequencies and the transition events associated with the test steps.
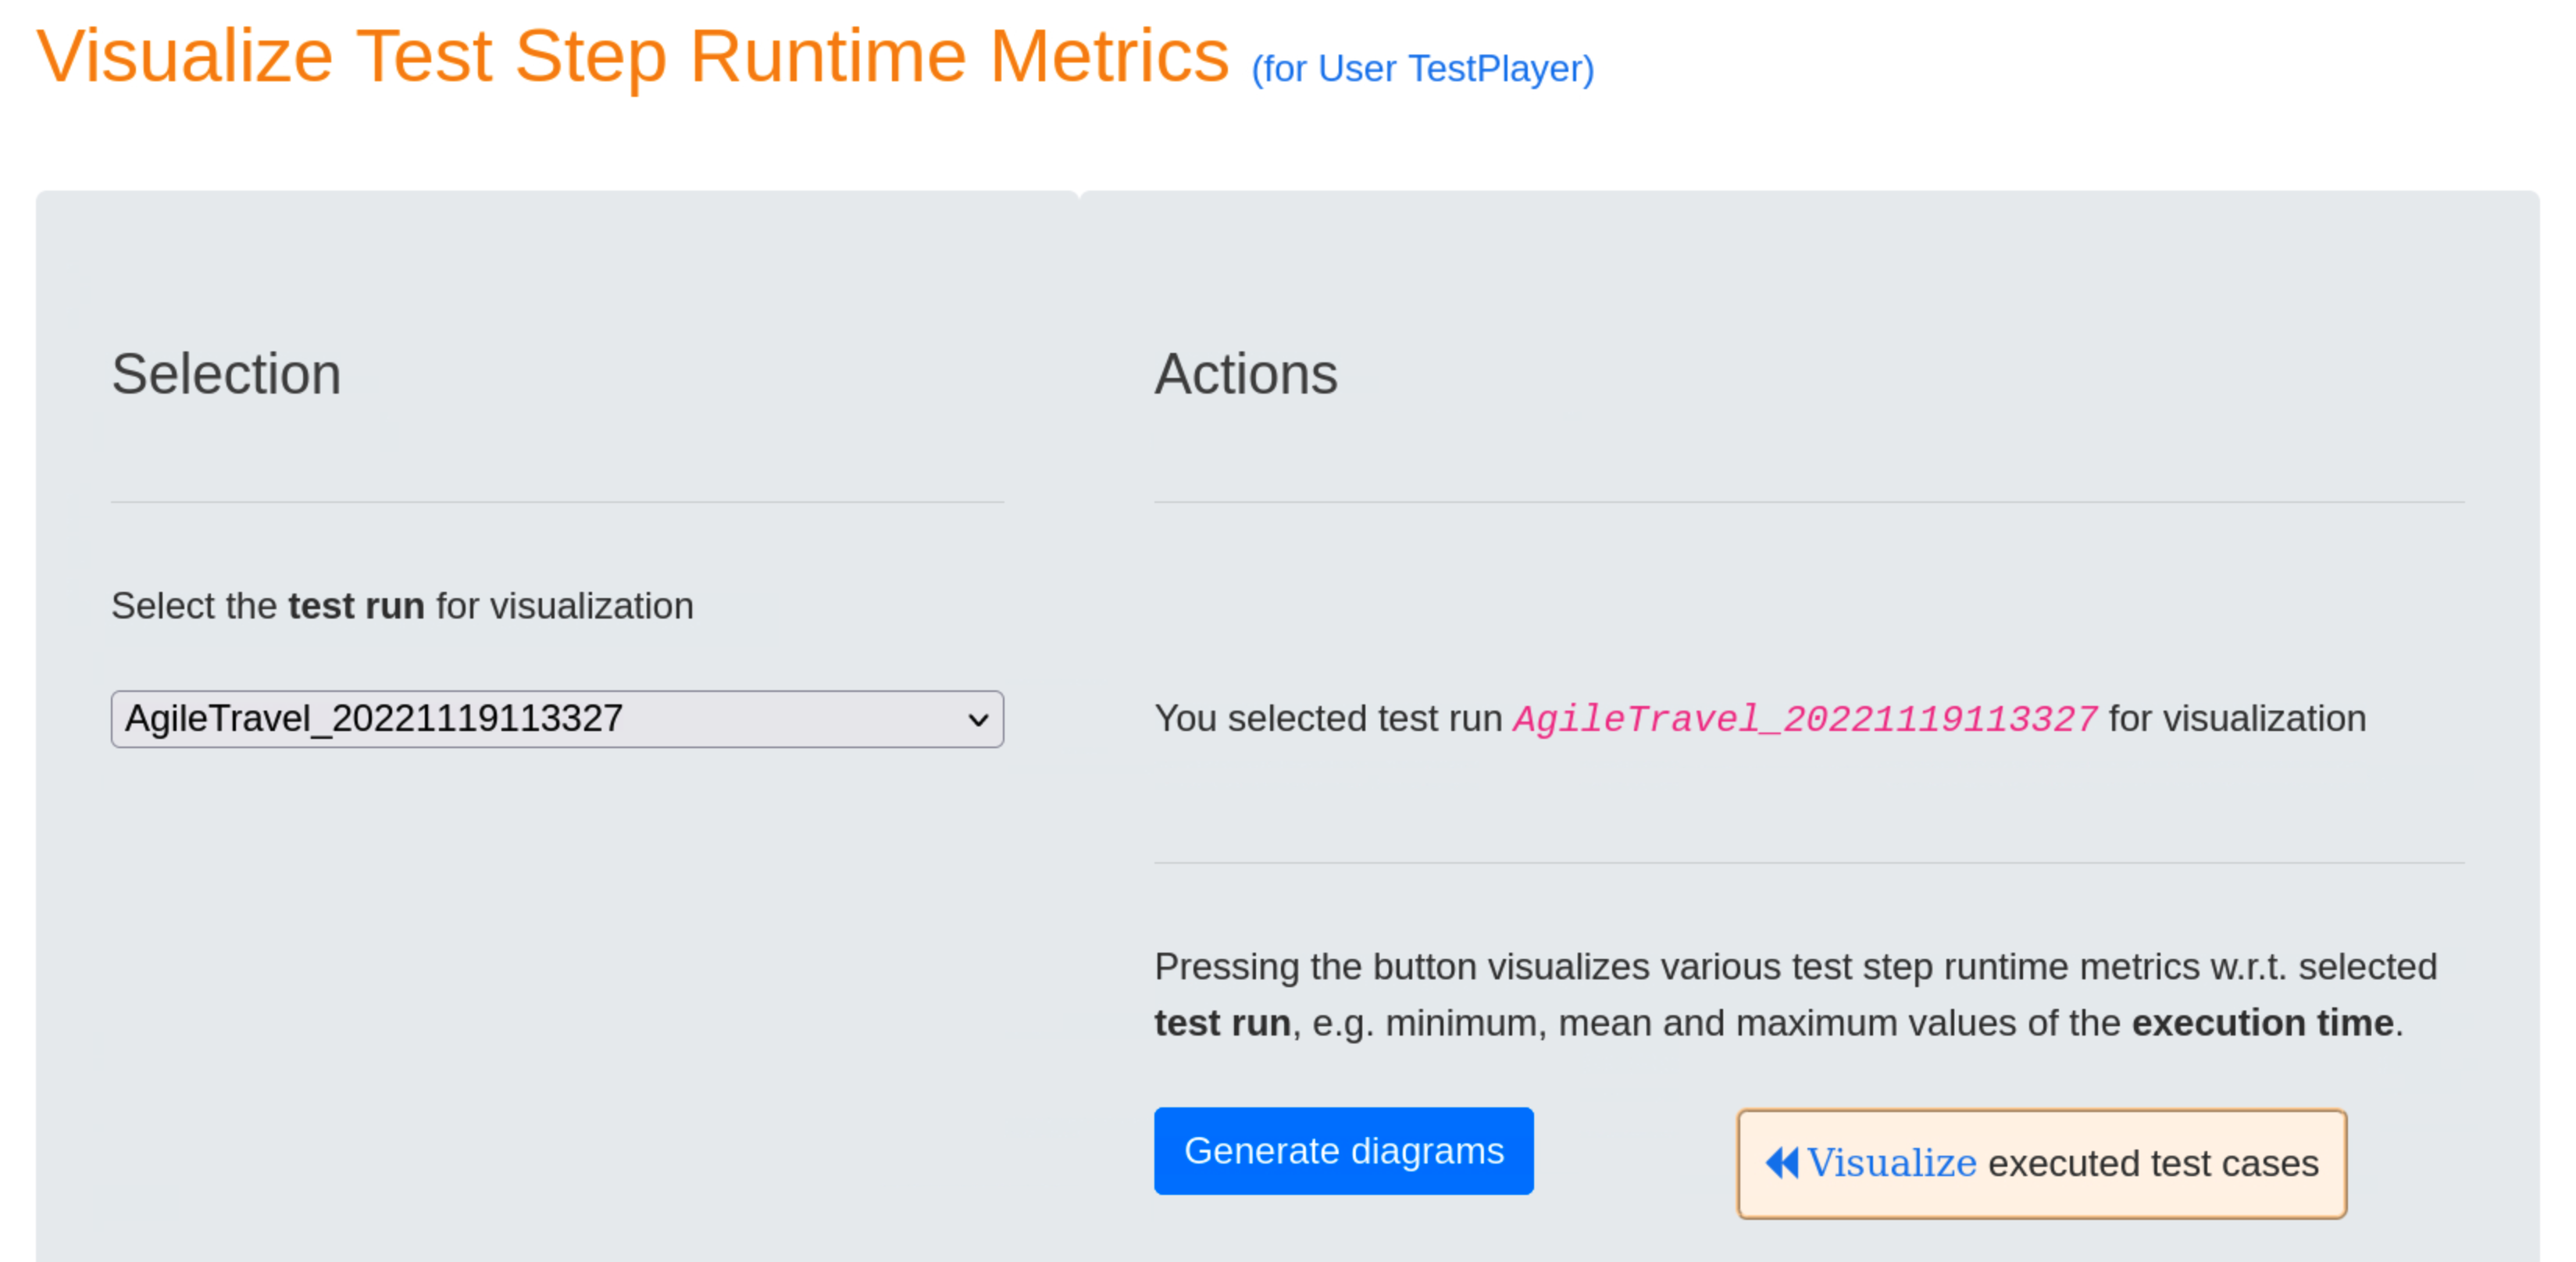
Visualize Test Step Runtime Metrics
Test step and transition event frequencies of individual test cases in relation to the selected test run and the associated test suite are visualized after pressing the blue Generate diagrams button and the Visualize link.
The first three graphs show mean, minimum and maximum of the test step execution times for the test run with the unique timestamp 20221119113327 and the associated test suite with the unique timestamp 20221118133827. All three graphs look very similar and show a characteristic pattern for the test run.


The following diagramm shows the sorted frequencies of the test steps for the test run with the unique timestamp 20221119113327 and the associated test suite with the unique timestamp 20221118133827. As can be seen, test step Correct_Sign_in_26, for example, is executed exactly four times.

The next two charts contains the sum and the sorted sum of the test step execution times for the test run with the unique timestamp 20221119113327 and the associated test suite with the unique timestamp 20221118133827. This is particularly interesting for finding candidates for application performance optimization, e.g. Correct_Sign_in_26.


The last diagramm shows the sorted mean of the test step execution times for the test run with the unique timestamp 20221119113327 and the associated test suite with the unique timestamp 20221118133827. This chart is also interesting for finding candidates for application performance optimization, e.g. Pay_now_92.

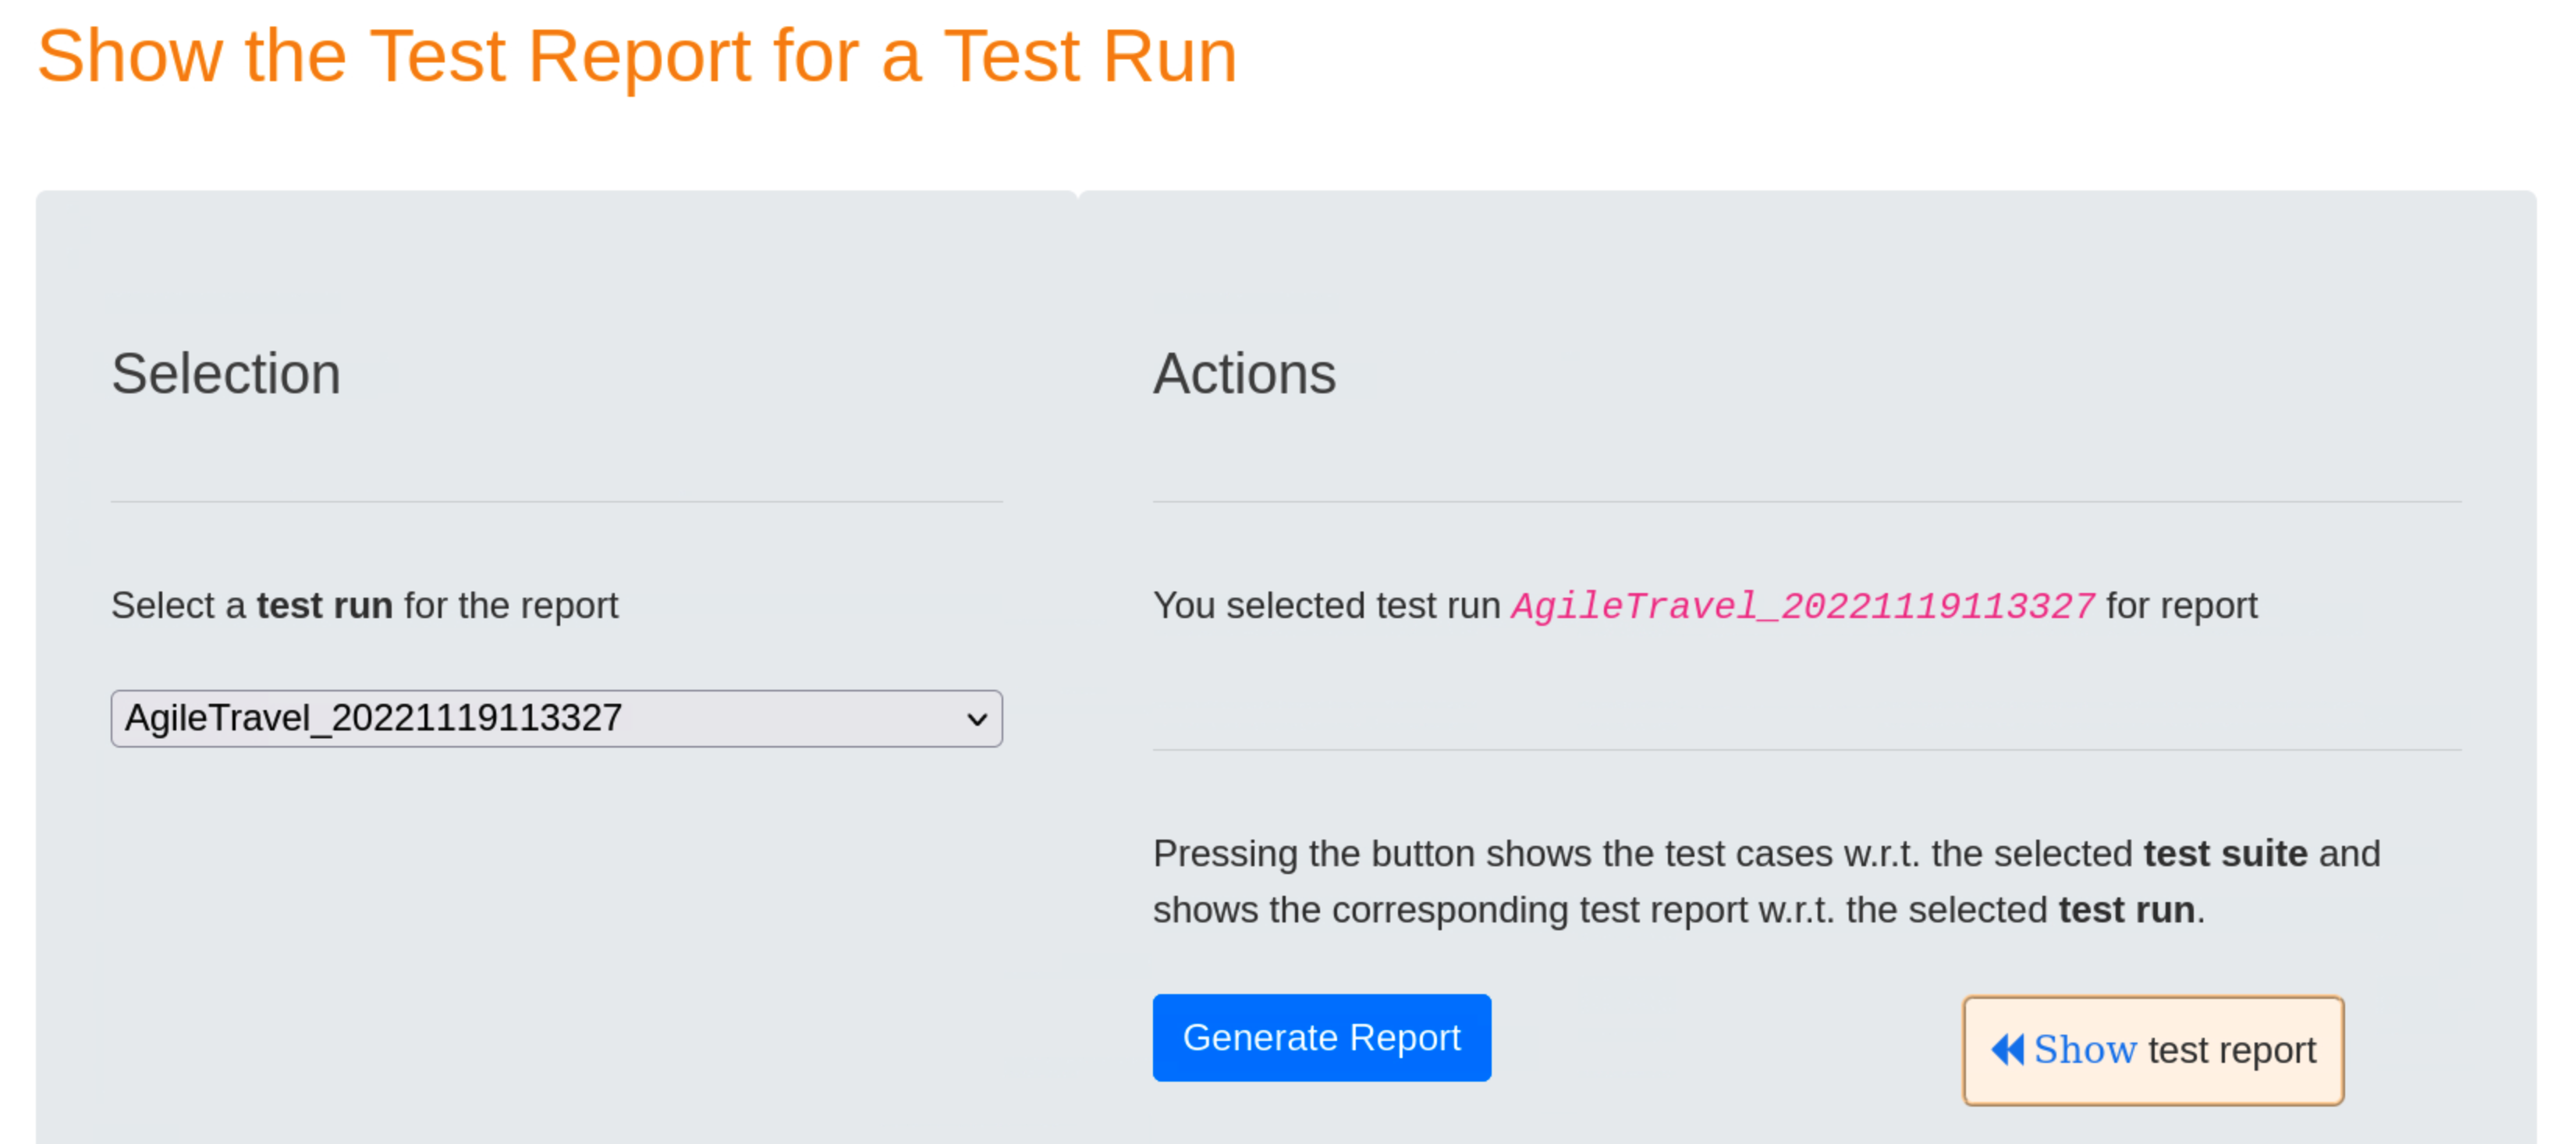
Show Test Report
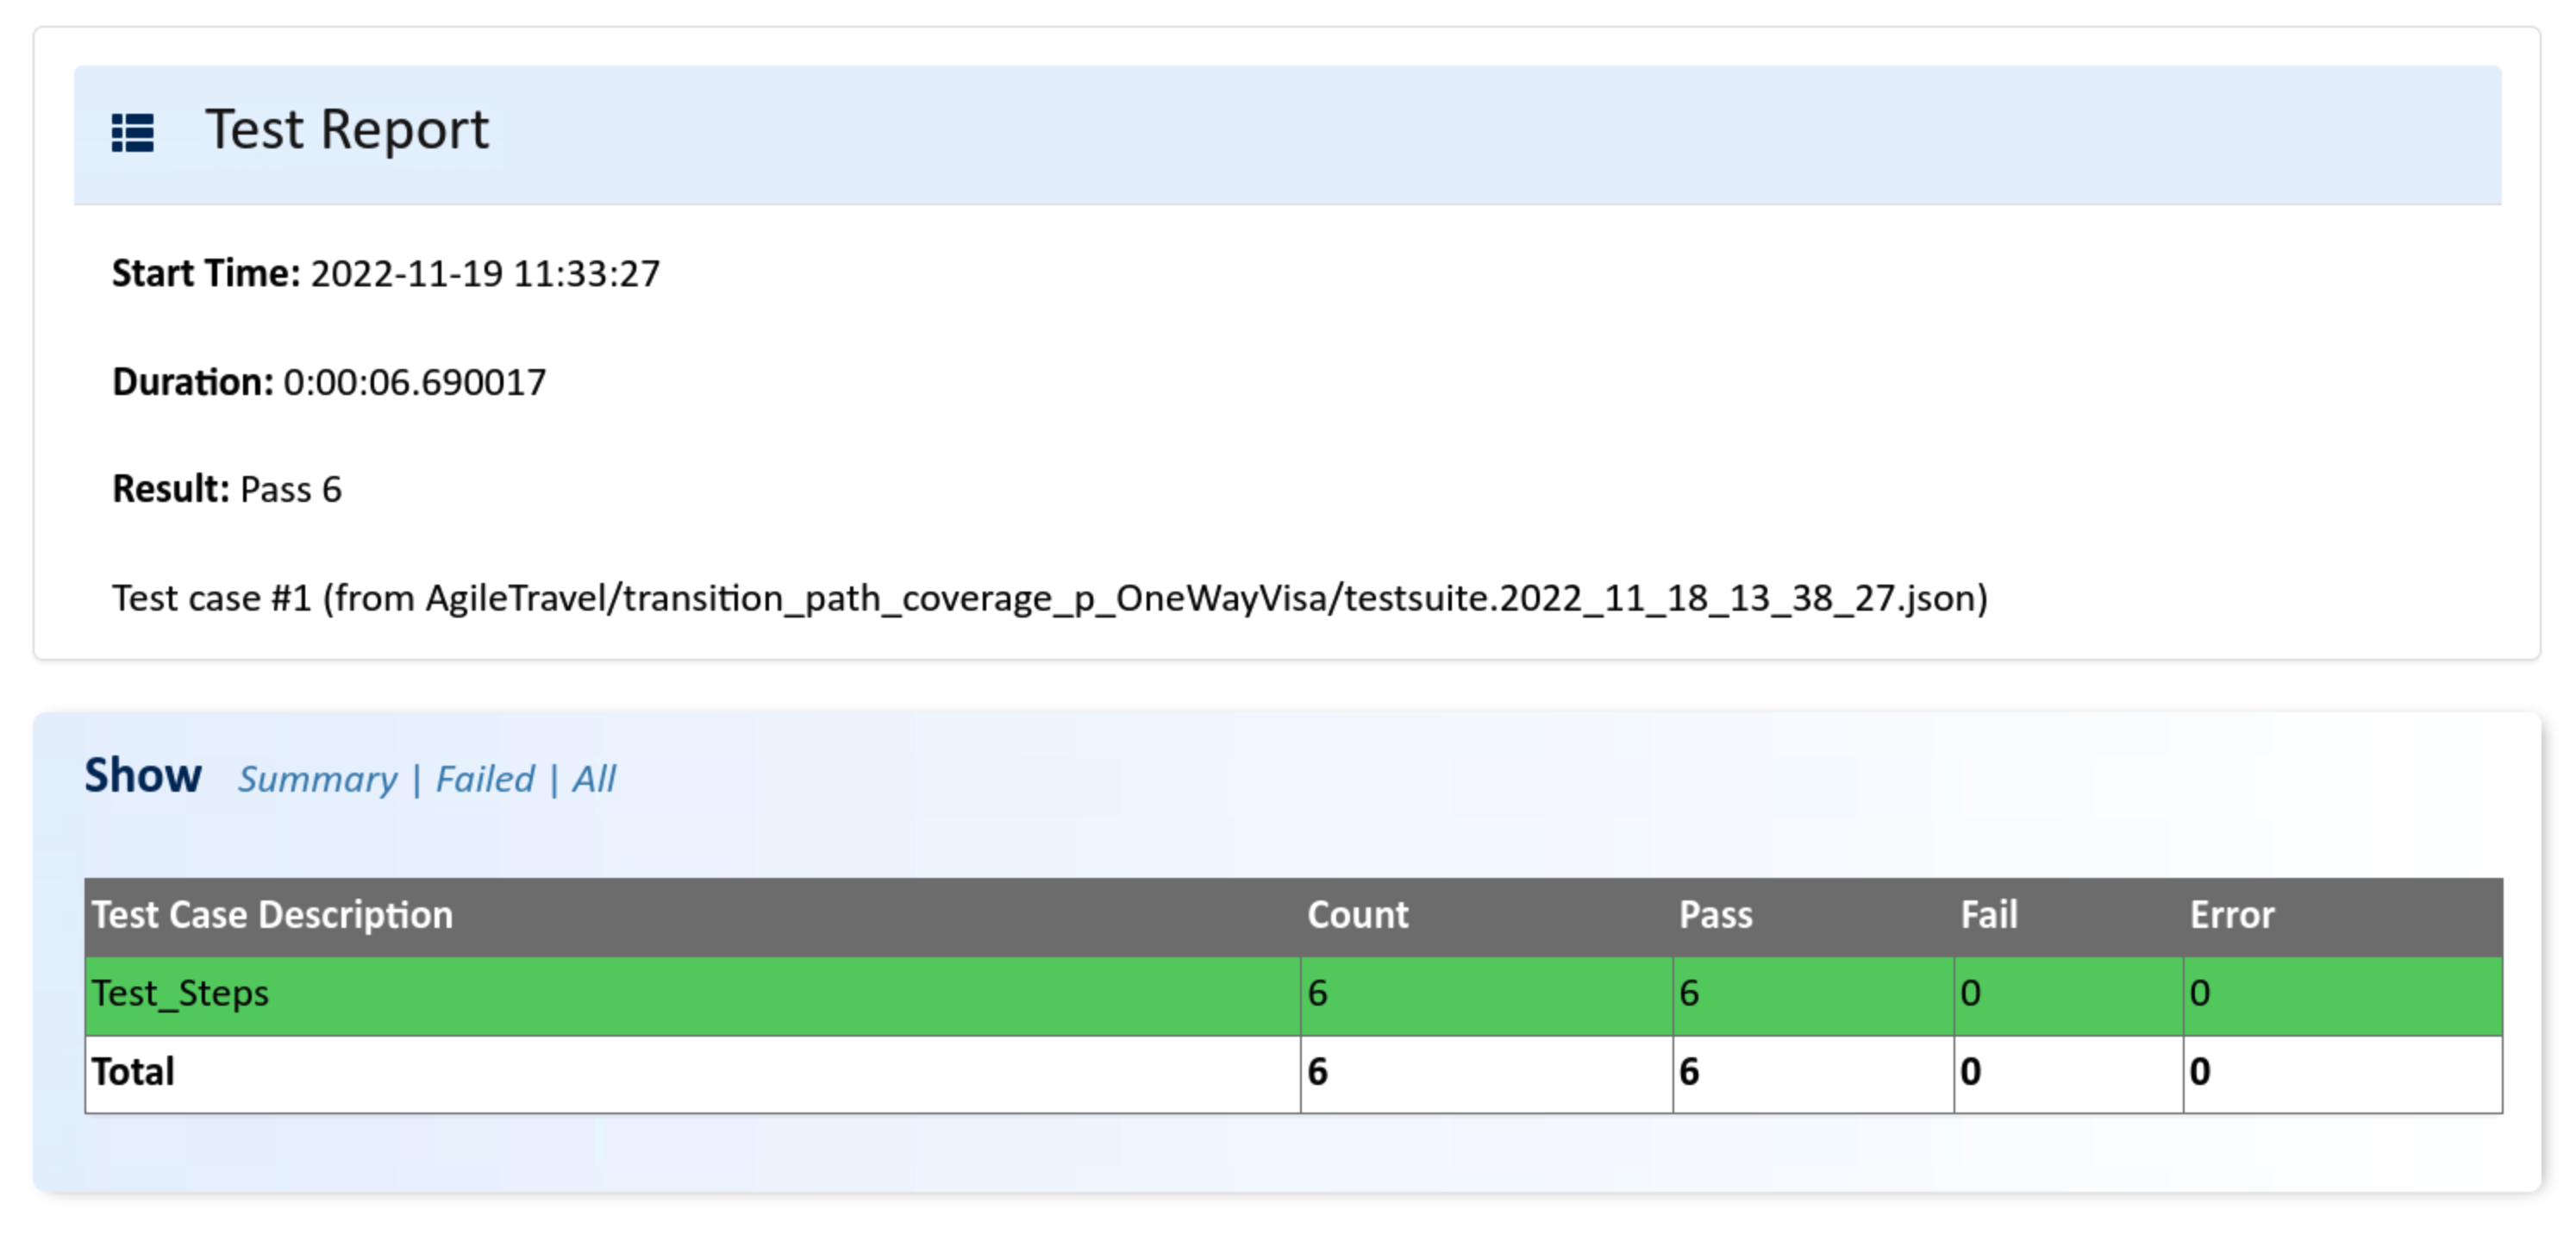
After having selected test run 20221119113327, pressing the blue Generate Report button will result in displaying a detailed report after the « Show Test Report link has been selected.
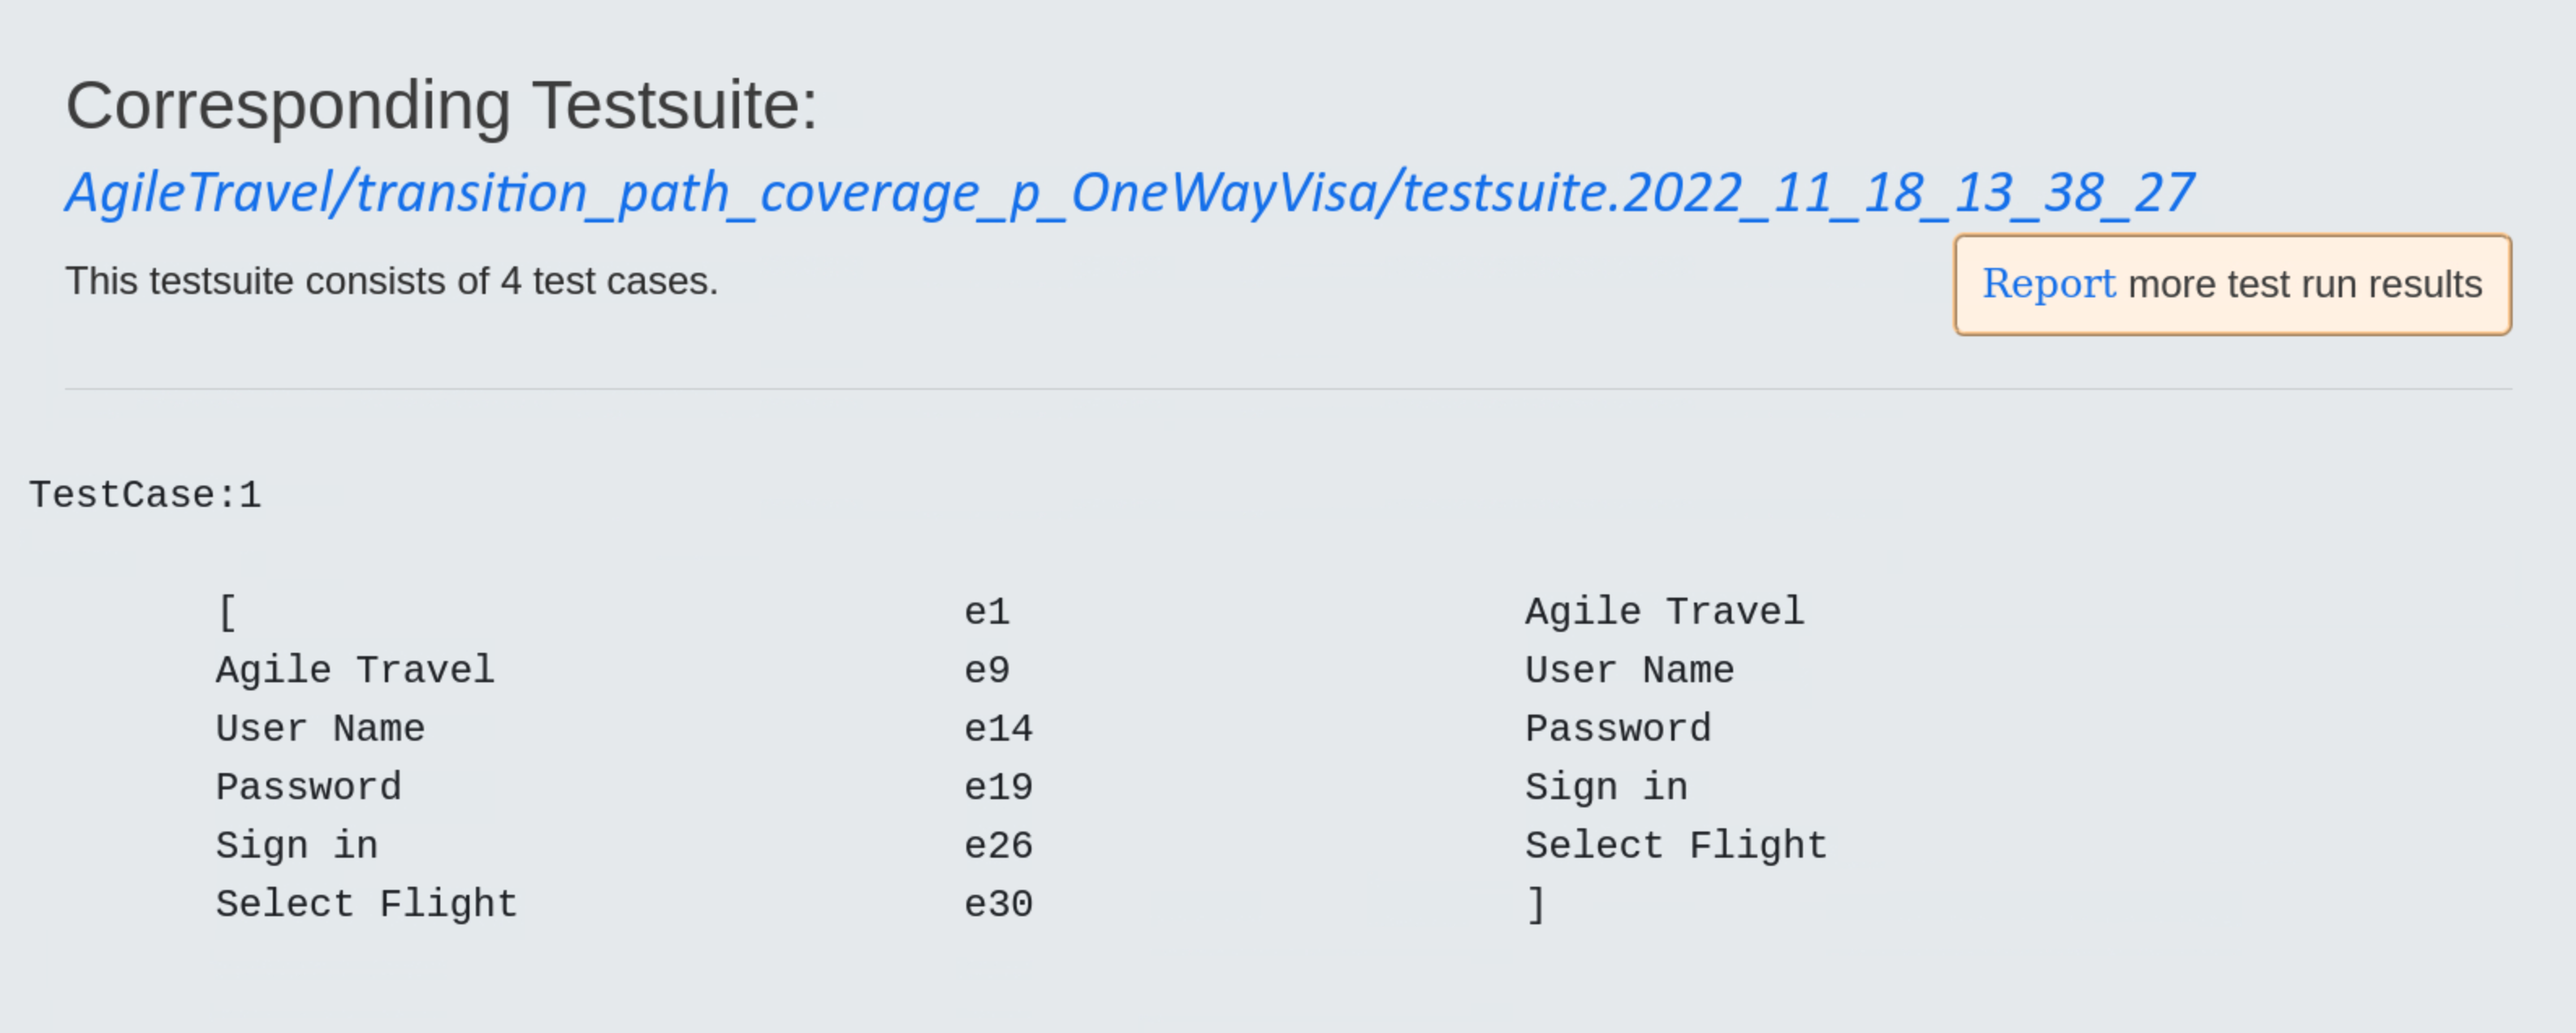
The test report includes
- the unique test run
- the unique test suite
- for each test case the specific test steps and a detailed test verdict
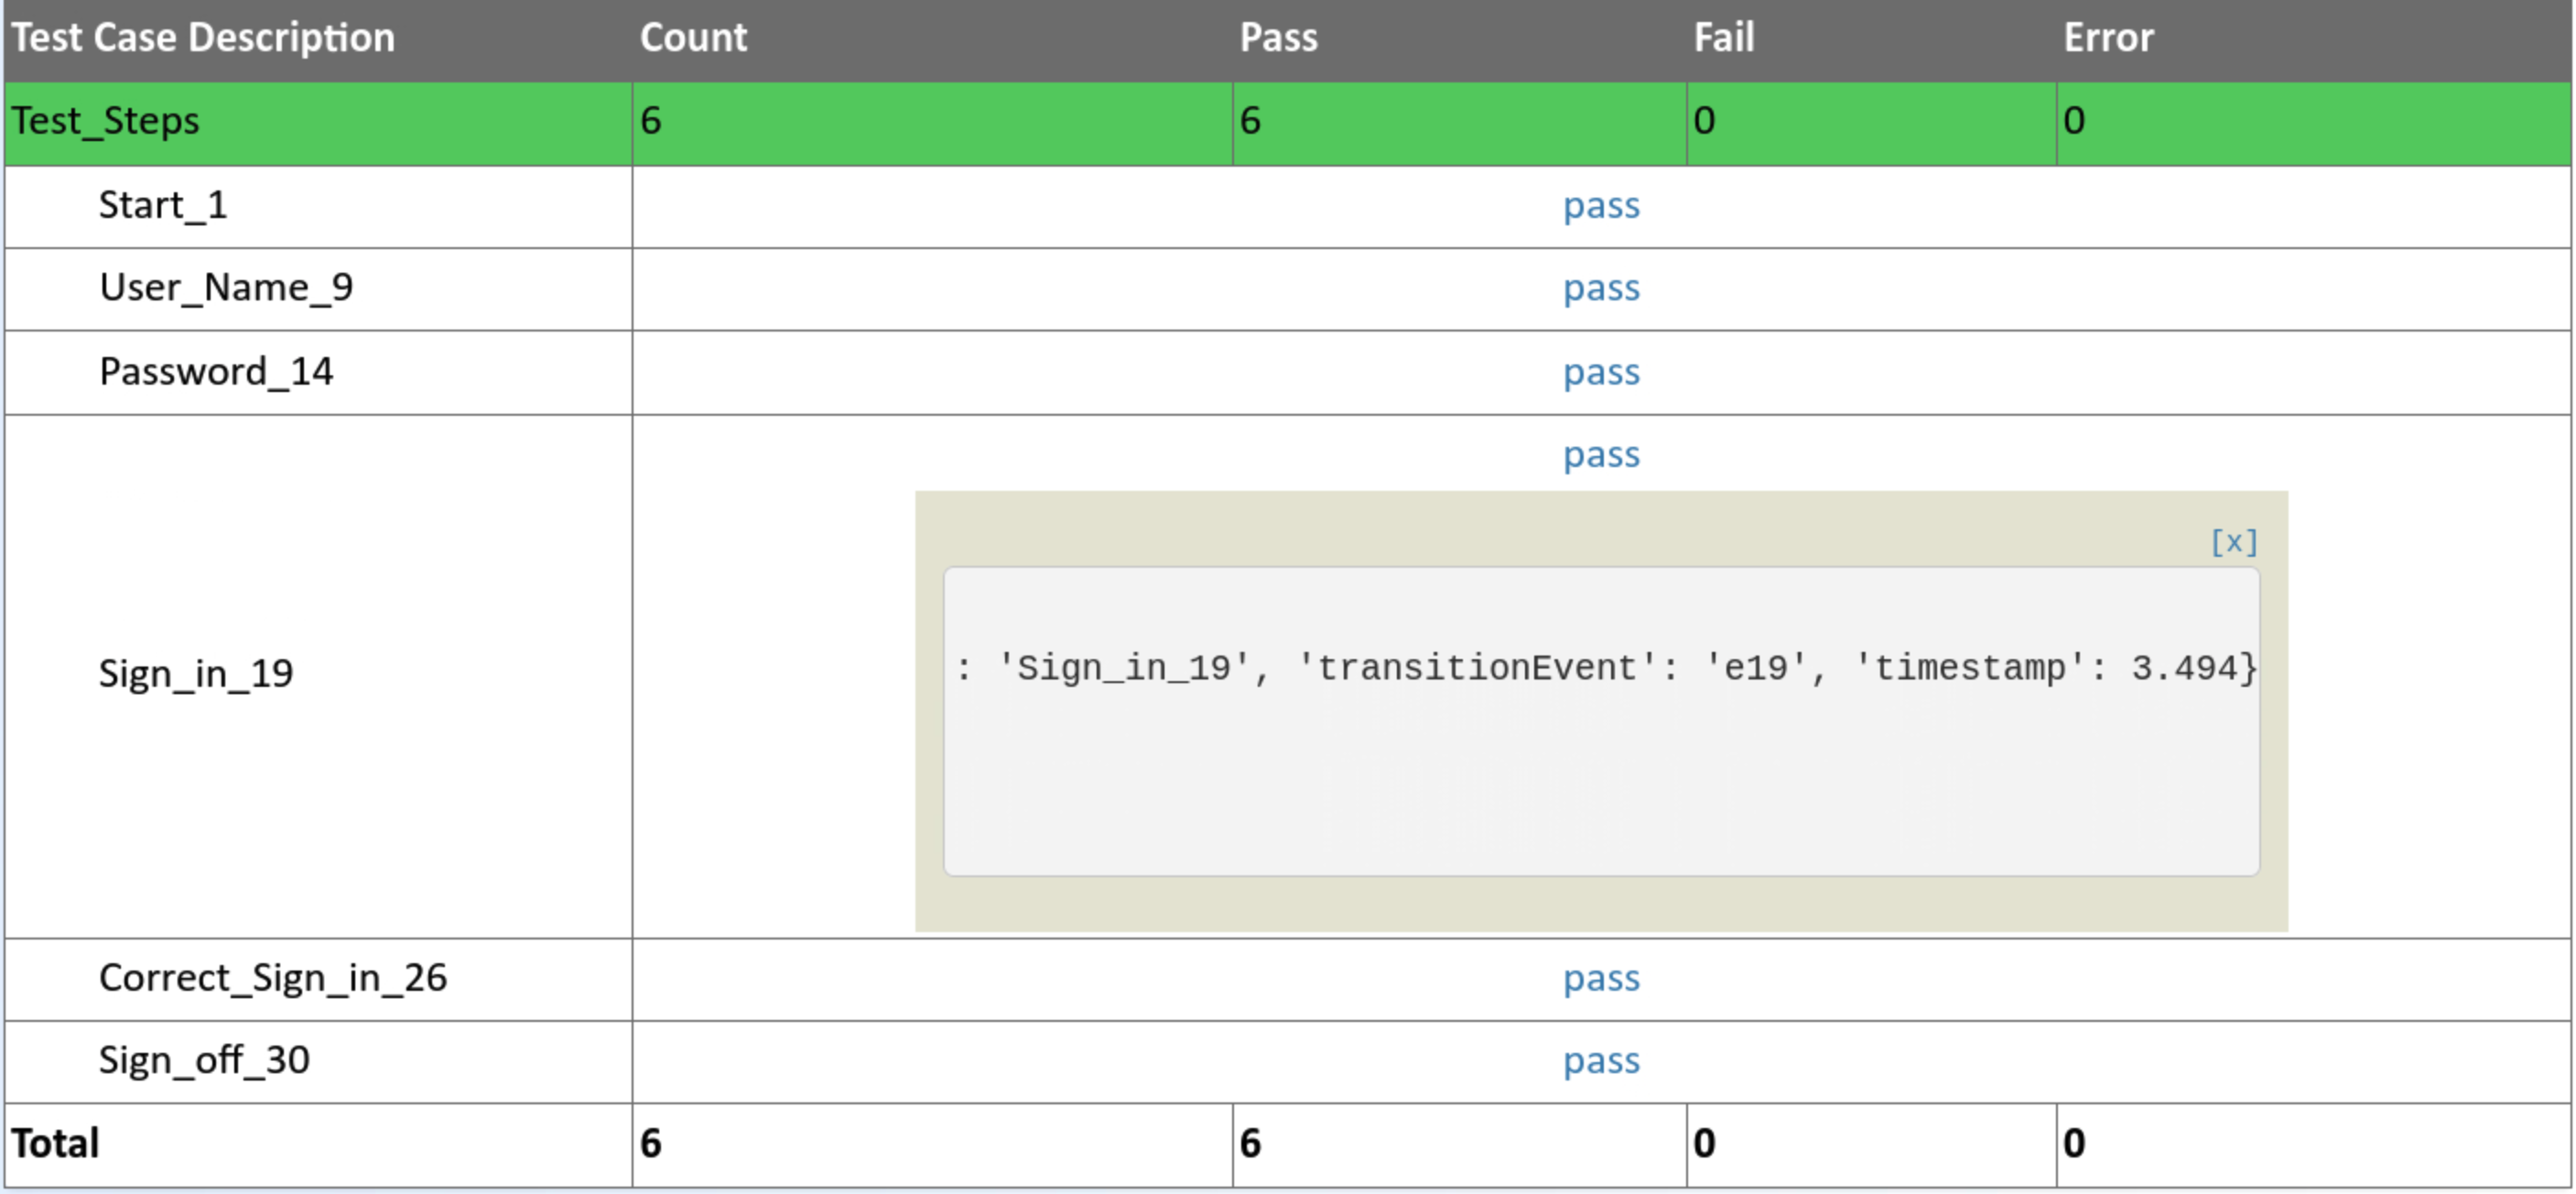
Summary mode displays a summary of the test report, showing the test case number,start time, duration and result (Pass or Failed) of the test case.
The All mode shows more details for each of the test steps in the test case.
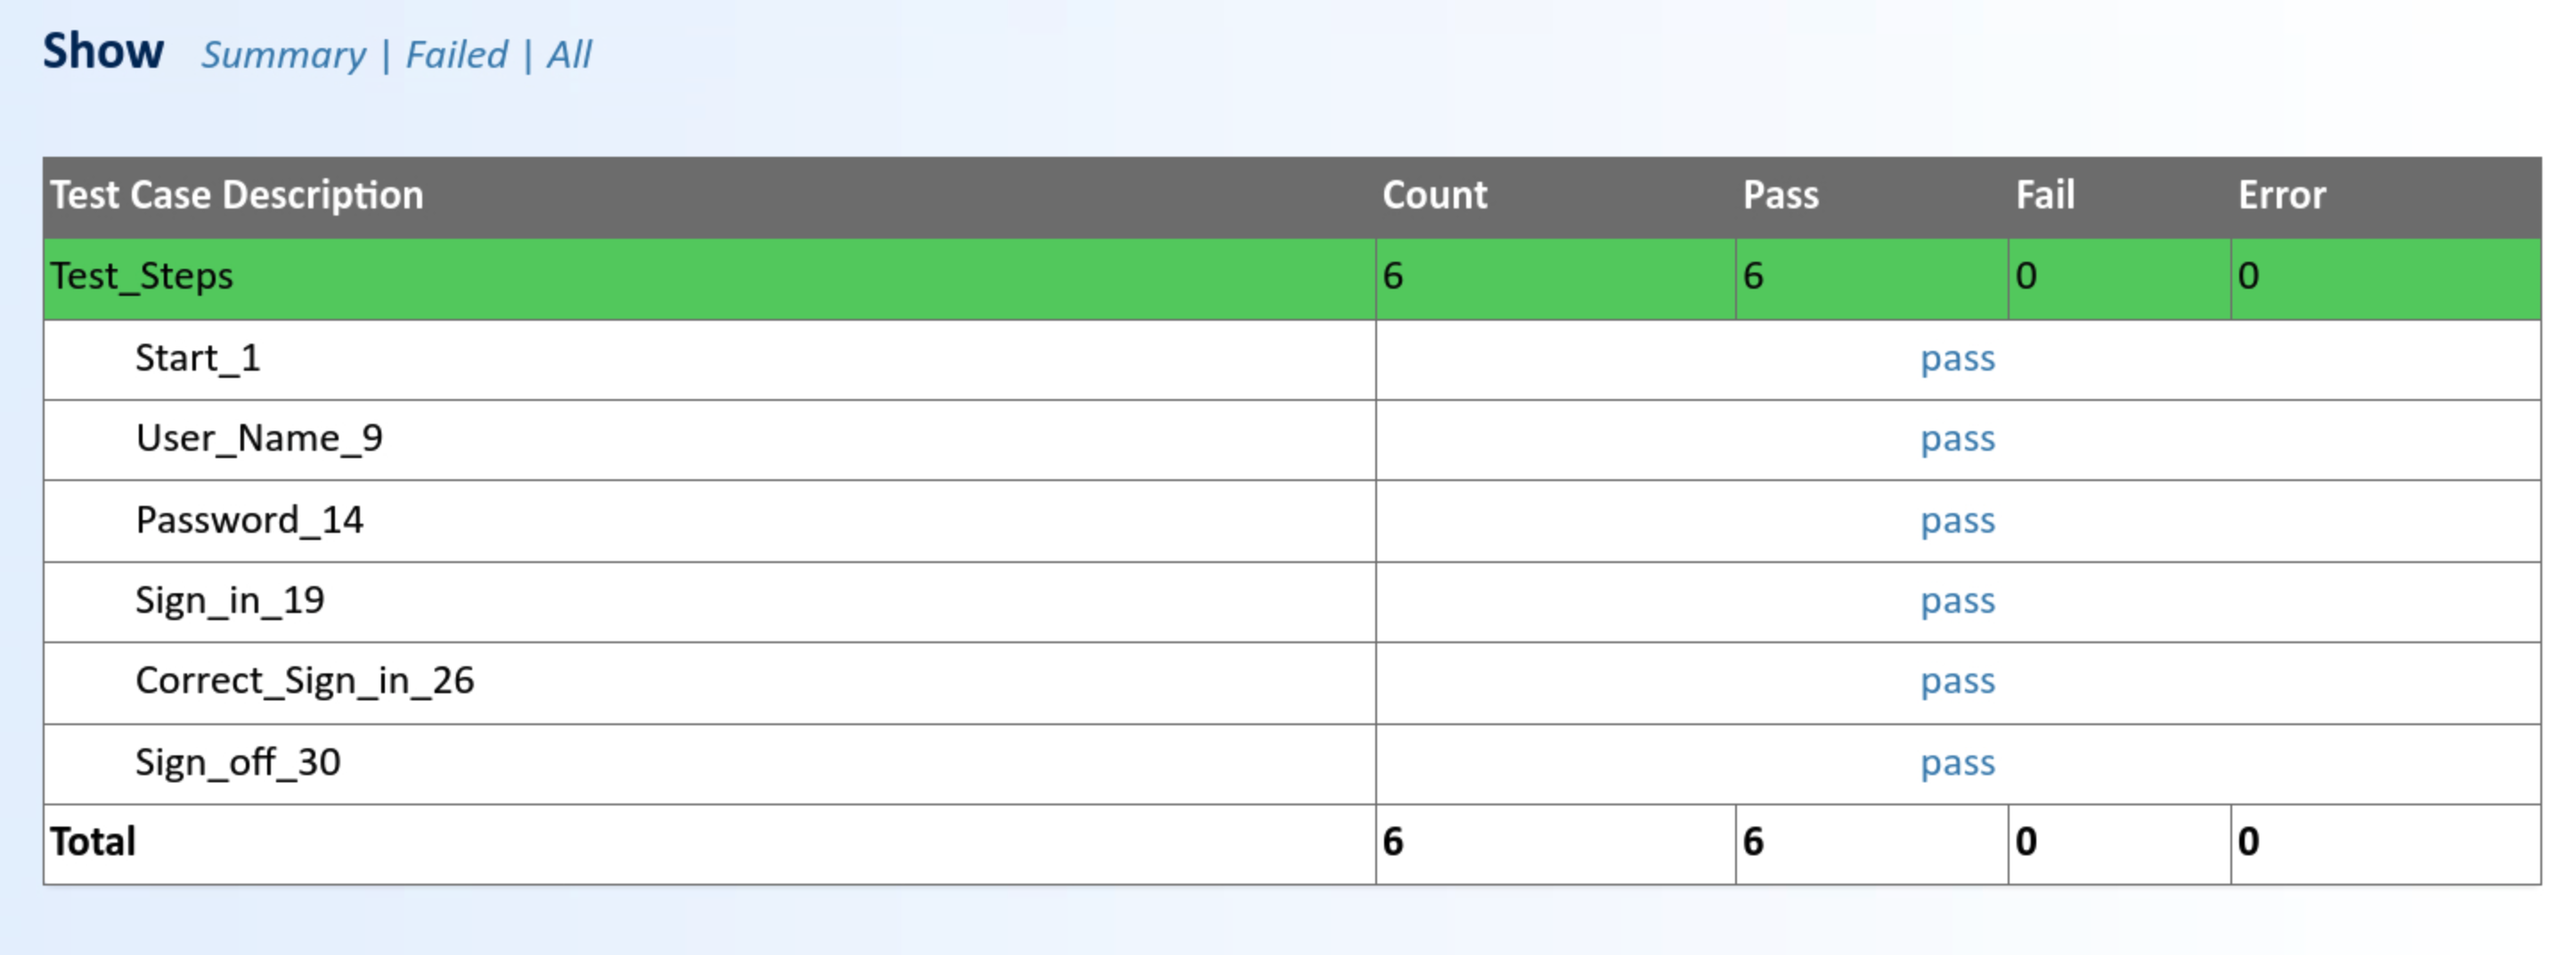
Additional data for each test step, i.e. test case number, transition event and timestamp when the test step was executed, is displayed by pressing on the test verdict pass.